County łowickiSejm constituency no. 11,

| County łowicki | |
| Statistic on 09.10.2011 | |
| Inhabitants: | 81 451 |
| Summary voting results | |
| Precincts quantity: | 65 |
| Number of precincts which transmitted result data: | 65 |
| Electors: | 66 725 |
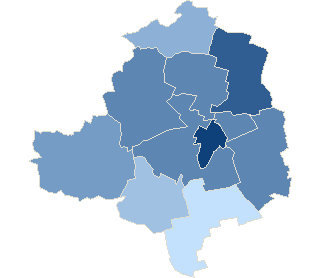
| Number of valid ballot cards: | 30 013 |
| 44.98 % | |

|
|
| No data | 33,14% - 34,94% | 34,95% - 36,75% | 36,76% - 38,56% | 38,57% - 40,37% | 40,38% - 42,18% | 42,19% - 43,99% | 44,00% - 45,80% | 45,81% - 47,61% | 47,62% - 49,42% | 49,43% - 51,23% |
County łowickiSejm constituency no. 11,
| County łowicki | |
| Statistic on 09.10.2011 | |
| Inhabitants: | 81 451 |
| Summary voting results | |
| Precincts quantity: | 65 |
| Number of precincts which transmitted result data: | 65 |
| Electors: | 66 725 |
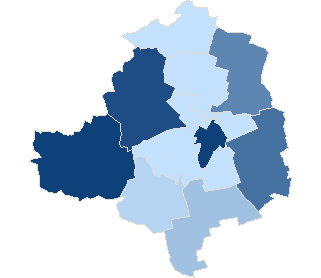
| Number of valid ballot cards: | 30 033 |
| 45.01 % | |
|
|
|
| No data | 33,14% - 34,95% | 34,96% - 36,77% | 36,78% - 38,59% | 38,60% - 40,41% | 40,42% - 42,23% | 42,24% - 44,05% | 44,06% - 45,87% | 45,88% - 47,69% | 47,70% - 49,51% | 49,52% - 51,33% |
County łowickiSejm constituency no. 11,
| County łowicki | |
| Statistic on 09.10.2011 | |
| Inhabitants: | 81 451 |
| Summary voting results | |
| Precincts quantity: | 65 |
| Number of precincts which transmitted result data: | 65 |
| Electors: | 66 725 |
| Number of ballot papers issued: | 1 348 |
| 2.03 % | |
|
|
|
| No data | 0,88% - 1,05% | 1,06% - 1,23% | 1,24% - 1,41% | 1,42% - 1,59% | 1,60% - 1,77% | 1,78% - 1,95% | 1,96% - 2,13% | 2,14% - 2,31% | 2,32% - 2,49% | 2,50% - 2,67% |
County łowickiSejm constituency no. 11,
| County łowicki | |
| Statistic on 09.10.2011 | |
| Inhabitants: | 81 451 |
| Summary voting results | |
| Precincts quantity: | 65 |
| Number of precincts which transmitted result data: | 65 |
| Electors: | 66 725 |
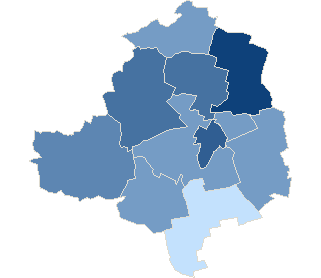
| Number of ballot papers issued: | 15 156 |
| 22.78 % | |
|
|
|
| No data | 13,74% - 15,29% | 15,30% - 16,85% | 16,86% - 18,41% | 18,42% - 19,97% | 19,98% - 21,53% | 21,54% - 23,09% | 23,10% - 24,65% | 24,66% - 26,21% | 26,22% - 27,77% | 27,78% - 29,33% |
County łowickiSejm constituency no. 11,
| County łowicki | |
| Statistic on 09.10.2011 | |
| Inhabitants: | 81 451 |
| Summary voting results | |
| Precincts quantity: | 65 |
| Number of precincts which transmitted result data: | 65 |
| Electors: | 66 725 |
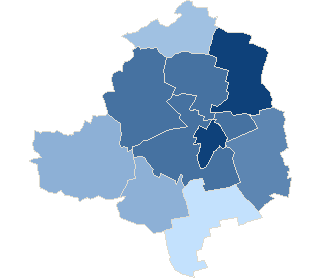
| Number of ballot papers issued: | 25 198 |
| 37.82 % | |
|
|
|
| No data | 27,39% - 28,91% | 28,92% - 30,44% | 30,45% - 31,97% | 31,98% - 33,50% | 33,51% - 35,03% | 35,04% - 36,56% | 36,57% - 38,09% | 38,10% - 39,62% | 39,63% - 41,15% | 41,16% - 42,68% |
| Attendance | ||||||||
| Constituency no. | Teryt | Name | Precincts quantity | Electors | Number of valid ballot cards | Number of valid ballot cards / Electors | ||
| total | which provided data | |||||||
| 11 | 100502 | gm. Bielawy | 8 | 8 | 4825 | 1955 | 40.52 % | |
| 11 | 100503 | gm. Chąśno | 3 | 3 | 2486 | 1057 | 42.52 % | |
| 11 | 100504 | gm. Domaniewice | 3 | 3 | 3804 | 1466 | 38.54 % | |
| 11 | 100505 | gm. Kiernozia | 3 | 3 | 2943 | 1169 | 39.72 % | |
| 11 | 100506 | gm. Kocierzew Południowy | 3 | 3 | 3587 | 1688 | 47.06 % | |
| 11 | 100507 | gm. Łowicz | 8 | 8 | 5981 | 2584 | 43.20 % | |
| 11 | 100501 | m. Łowicz | 18 | 18 | 25041 | 12808 | 51.15 % | |
| 11 | 100508 | gm. Łyszkowice | 8 | 8 | 5411 | 1793 | 33.14 % | |
| 11 | 100509 | gm. Nieborów | 7 | 7 | 7679 | 3310 | 43.10 % | |
| 11 | 100510 | gm. Zduny | 4 | 4 | 4968 | 2183 | 43.94 % | |
| Attendance by level types | |||||||
| No. | Description | Precincts quantity | Electors | Number of valid ballot cards | Number of valid ballot cards / Electors | ||
| total | which provided data | ||||||
| 1 | city | 18 | 18 | 25 041 | 12 808 | 51.15 % | |
| 2 | village | 47 | 47 | 41 684 | 17 205 | 41.27 % | |
| Maximum attendance | ||||||||
| Code | Level | Name | Precincts quantity | Electors | Number of valid ballot cards | Number of valid ballot cards / Electors | ||
| total | which provided data | |||||||
| 100501 | Commune | m. Łowicz | 18 | 18 | 25 041 | 12 808 | 51.15 % | |
| Minimum attendance | ||||||||
| Code | Level | Name | Precincts quantity | Electors | Number of valid ballot cards | Number of valid ballot cards / Electors | ||
| total | which provided data | |||||||
| 100508 | Commune | gm. Łyszkowice | 8 | 8 | 5 411 | 1 793 | 33.14 % | |
- Information service info.pkw.gov.pl
- Copyright © 2011 KBW
- Contact:helpdesk@kbw.gov.pl
- Infoline: 801-081-555
- Last modification date: 10-11-2011 21:03:27
