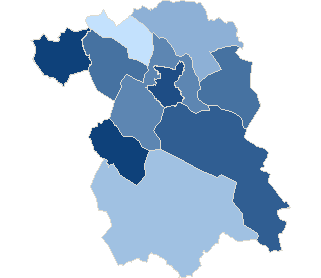
County gorlickiSejm constituency no. 14,

| County gorlicki | |
| Statistic on 09.10.2011 | |
| Inhabitants: | 110 624 |
| Summary voting results | |
| Precincts quantity: | 91 |
| Number of precincts which transmitted result data: | 91 |
| Electors: | 86 812 |
| Number of valid ballot cards: | 39 808 |
| 45.86 % | |

|
|
| No data | 39,22% - 40,24% | 40,25% - 41,26% | 41,27% - 42,29% | 42,30% - 43,32% | 43,33% - 44,34% | 44,35% - 45,36% | 45,37% - 46,38% | 46,39% - 47,40% | 47,41% - 48,42% | 48,43% - 49,44% |
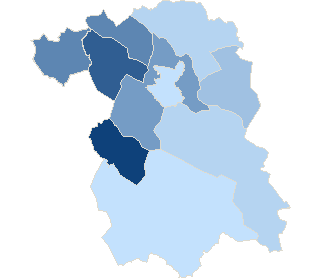
County gorlickiSejm constituency no. 14,
| County gorlicki | |
| Statistic on 09.10.2011 | |
| Inhabitants: | 110 624 |
| Summary voting results | |
| Precincts quantity: | 91 |
| Number of precincts which transmitted result data: | 91 |
| Electors: | 86 812 |
| Number of valid ballot cards: | 39 803 |
| 45.85 % | |
|
|
|
| No data | 39,22% - 40,23% | 40,24% - 41,25% | 41,26% - 42,27% | 42,28% - 43,29% | 43,30% - 44,31% | 44,32% - 45,33% | 45,34% - 46,35% | 46,36% - 47,37% | 47,38% - 48,39% | 48,40% - 49,41% |
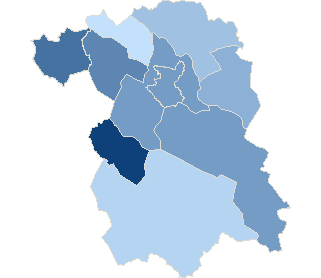
County gorlickiSejm constituency no. 14,
| County gorlicki | |
| Statistic on 09.10.2011 | |
| Inhabitants: | 110 624 |
| Summary voting results | |
| Precincts quantity: | 91 |
| Number of precincts which transmitted result data: | 91 |
| Electors: | 86 812 |
| Number of ballot papers issued: | 5 250 |
| 6.08 % | |
|
|
|
| No data | 4,54% - 5,04% | 5,05% - 5,55% | 5,56% - 6,06% | 6,07% - 6,57% | 6,58% - 7,08% | 7,09% - 7,59% | 7,60% - 8,10% | 8,11% - 8,61% | 8,62% - 9,12% | 9,13% - 9,63% |
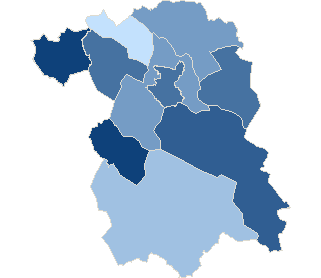
County gorlickiSejm constituency no. 14,
| County gorlicki | |
| Statistic on 09.10.2011 | |
| Inhabitants: | 110 624 |
| Summary voting results | |
| Precincts quantity: | 91 |
| Number of precincts which transmitted result data: | 91 |
| Electors: | 86 812 |
| Number of ballot papers issued: | 23 718 |
| 27.38 % | |
|
|
|
| No data | 23,00% - 24,05% | 24,06% - 25,11% | 25,12% - 26,17% | 26,18% - 27,23% | 27,24% - 28,29% | 28,30% - 29,35% | 29,36% - 30,41% | 30,42% - 31,47% | 31,48% - 32,53% | 32,54% - 33,59% |
County gorlickiSejm constituency no. 14,
| County gorlicki | |
| Statistic on 09.10.2011 | |
| Inhabitants: | 110 624 |
| Summary voting results | |
| Precincts quantity: | 91 |
| Number of precincts which transmitted result data: | 91 |
| Electors: | 86 812 |
| Number of ballot papers issued: | 35 350 |
| 40.74 % | |
|
|
|
| No data | 35,54% - 36,42% | 36,43% - 37,31% | 37,32% - 38,20% | 38,21% - 39,09% | 39,10% - 39,98% | 39,99% - 40,87% | 40,88% - 41,76% | 41,77% - 42,65% | 42,66% - 43,54% | 43,55% - 44,43% |
| Attendance | ||||||||
| Constituency no. | Teryt | Name | Precincts quantity | Electors | Number of valid ballot cards | Number of valid ballot cards / Electors | ||
| total | which provided data | |||||||
| 14 | 120502 | gm. Biecz | 13 | 13 | 13683 | 5914 | 43.22 % | |
| 14 | 120503 | gm. Bobowa | 8 | 8 | 7076 | 3447 | 48.71 % | |
| 14 | 120501 | m. Gorlice | 22 | 22 | 23972 | 11569 | 48.26 % | |
| 14 | 120504 | gm. Gorlice | 11 | 11 | 13272 | 5948 | 44.82 % | |
| 14 | 120505 | gm. Lipinki | 7 | 7 | 5433 | 2489 | 45.81 % | |
| 14 | 120506 | gm. Łużna | 7 | 7 | 6492 | 2950 | 45.44 % | |
| 14 | 120507 | gm. Moszczenica | 3 | 3 | 3799 | 1490 | 39.22 % | |
| 14 | 120508 | gm. Ropa | 4 | 4 | 3942 | 1946 | 49.37 % | |
| 14 | 120509 | gm. Sękowa | 6 | 6 | 3954 | 1866 | 47.19 % | |
| 14 | 120510 | gm. Uście Gorlickie | 10 | 10 | 5189 | 2189 | 42.19 % | |
| Attendance by level types | |||||||
| No. | Description | Precincts quantity | Electors | Number of valid ballot cards | Number of valid ballot cards / Electors | ||
| total | which provided data | ||||||
| 1 | city | 22 | 22 | 23 972 | 11 569 | 48.26 % | |
| 2 | village | 48 | 48 | 42 081 | 18 878 | 44.86 % | |
| 3 | urban-rural area | 21 | 21 | 20 759 | 9 361 | 45.09 % | |
| Maximum attendance | ||||||||
| Code | Level | Name | Precincts quantity | Electors | Number of valid ballot cards | Number of valid ballot cards / Electors | ||
| total | which provided data | |||||||
| 120508 | Commune | gm. Ropa | 4 | 4 | 3 942 | 1 946 | 49.37 % | |
| Minimum attendance | ||||||||
| Code | Level | Name | Precincts quantity | Electors | Number of valid ballot cards | Number of valid ballot cards / Electors | ||
| total | which provided data | |||||||
| 120507 | Commune | gm. Moszczenica | 3 | 3 | 3 799 | 1 490 | 39.22 % | |
- Information service info.pkw.gov.pl
- Copyright © 2011 KBW
- Contact:helpdesk@kbw.gov.pl
- Infoline: 801-081-555
- Last modification date: 10-11-2011 21:03:27
