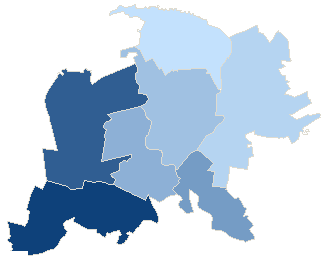
County niżańskiSejm constituency no. 23,

| County niżański | |
| Statistic on 09.10.2011 | |
| Inhabitants: | 68 178 |
| Summary voting results | |
| Precincts quantity: | 62 |
| Number of precincts which transmitted result data: | 62 |
| Electors: | 54 066 |
| Number of valid ballot cards: | 22 320 |
| 41.28 % | |

|
|
| No data | 35,59% - 36,73% | 36,74% - 37,88% | 37,89% - 39,03% | 39,04% - 40,18% | 40,19% - 41,33% | 41,34% - 42,48% | 42,49% - 43,63% | 43,64% - 44,78% | 44,79% - 45,93% | 45,94% - 47,08% |
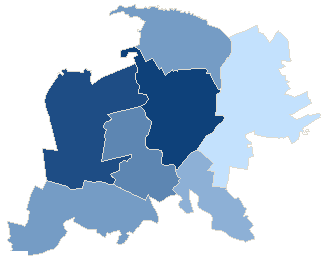
County niżańskiSejm constituency no. 23,
| County niżański | |
| Statistic on 09.10.2011 | |
| Inhabitants: | 68 178 |
| Summary voting results | |
| Precincts quantity: | 62 |
| Number of precincts which transmitted result data: | 62 |
| Electors: | 54 066 |
| Number of valid ballot cards: | 22 320 |
| 41.28 % | |
|
|
|
| No data | 35,62% - 36,75% | 36,76% - 37,89% | 37,90% - 39,04% | 39,05% - 40,18% | 40,19% - 41,32% | 41,33% - 42,46% | 42,47% - 43,60% | 43,61% - 44,74% | 44,75% - 45,88% | 45,89% - 47,02% |
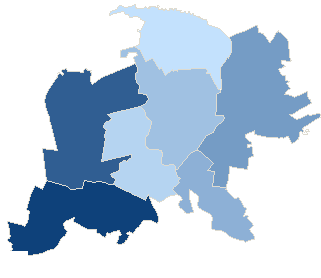
County niżańskiSejm constituency no. 23,
| County niżański | |
| Statistic on 09.10.2011 | |
| Inhabitants: | 68 178 |
| Summary voting results | |
| Precincts quantity: | 62 |
| Number of precincts which transmitted result data: | 62 |
| Electors: | 54 066 |
| Number of ballot papers issued: | 1 701 |
| 3.15 % | |
|
|
|
| No data | 1,29% - 1,57% | 1,58% - 1,86% | 1,87% - 2,15% | 2,16% - 2,44% | 2,45% - 2,73% | 2,74% - 3,02% | 3,03% - 3,31% | 3,32% - 3,60% | 3,61% - 3,89% | 3,90% - 4,18% |
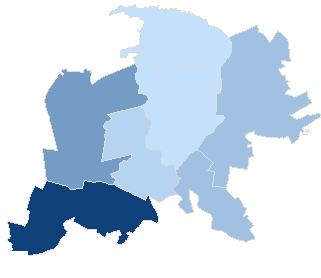
County niżańskiSejm constituency no. 23,
| County niżański | |
| Statistic on 09.10.2011 | |
| Inhabitants: | 68 178 |
| Summary voting results | |
| Precincts quantity: | 62 |
| Number of precincts which transmitted result data: | 62 |
| Electors: | 54 066 |
| Number of ballot papers issued: | 11 235 |
| 20.81 % | |
|
|
|
| No data | 18,06% - 18,60% | 18,61% - 19,15% | 19,16% - 19,70% | 19,71% - 20,25% | 20,26% - 20,80% | 20,81% - 21,35% | 21,36% - 21,90% | 21,91% - 22,45% | 22,46% - 23,00% | 23,01% - 23,55% |
County niżańskiSejm constituency no. 23,
| County niżański | |
| Statistic on 09.10.2011 | |
| Inhabitants: | 68 178 |
| Summary voting results | |
| Precincts quantity: | 62 |
| Number of precincts which transmitted result data: | 62 |
| Electors: | 54 066 |
| Number of ballot papers issued: | 18 730 |
| 34.66 % | |
|
|
|
| No data | 30,95% - 31,92% | 31,93% - 32,90% | 32,91% - 33,88% | 33,89% - 34,86% | 34,87% - 35,84% | 35,85% - 36,82% | 36,83% - 37,80% | 37,81% - 38,78% | 38,79% - 39,76% | 39,77% - 40,74% |
| Attendance | ||||||||
| Constituency no. | Teryt | Name | Precincts quantity | Electors | Number of valid ballot cards | Number of valid ballot cards / Electors | ||
| total | which provided data | |||||||
| 23 | 181201 | gm. Harasiuki | 6 | 6 | 5055 | 1904 | 37.67 % | |
| 23 | 181202 | gm. Jarocin | 7 | 7 | 4366 | 1554 | 35.59 % | |
| 23 | 181203 | gm. Jeżowe | 12 | 12 | 7663 | 3601 | 46.99 % | |
| 23 | 181204 | gm. Krzeszów | 5 | 5 | 3492 | 1405 | 40.23 % | |
| 23 | 181205 | gm. Nisko | 13 | 13 | 18174 | 7928 | 43.62 % | |
| 23 | 181206 | gm. Rudnik nad Sanem | 8 | 8 | 8320 | 3273 | 39.34 % | |
| 23 | 181207 | gm. Ulanów | 11 | 11 | 6996 | 2655 | 37.95 % | |
| Attendance by level types | |||||||
| No. | Description | Precincts quantity | Electors | Number of valid ballot cards | Number of valid ballot cards / Electors | ||
| total | which provided data | ||||||
| 1 | village | 30 | 30 | 20 576 | 8 464 | 41.14 % | |
| 2 | urban-rural area | 32 | 32 | 33 490 | 13 856 | 41.37 % | |
| Maximum attendance | ||||||||
| Code | Level | Name | Precincts quantity | Electors | Number of valid ballot cards | Number of valid ballot cards / Electors | ||
| total | which provided data | |||||||
| 181203 | Commune | gm. Jeżowe | 12 | 12 | 7 663 | 3 601 | 46.99 % | |
| Minimum attendance | ||||||||
| Code | Level | Name | Precincts quantity | Electors | Number of valid ballot cards | Number of valid ballot cards / Electors | ||
| total | which provided data | |||||||
| 181202 | Commune | gm. Jarocin | 7 | 7 | 4 366 | 1 554 | 35.59 % | |
- Information service info.pkw.gov.pl
- Copyright © 2011 KBW
- Contact:helpdesk@kbw.gov.pl
- Infoline: 801-081-555
- Last modification date: 10-11-2011 21:03:27
