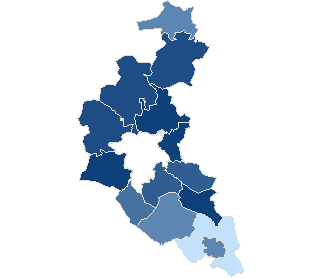
County rzeszowskiSejm constituency no. 23,

| County rzeszowski | |
| Statistic on 09.10.2011 | |
| Inhabitants: | 162 688 |
| Summary voting results | |
| Precincts quantity: | 123 |
| Number of precincts which transmitted result data: | 123 |
| Electors: | 127 249 |
| Number of valid ballot cards: | 63 607 |
| 49.99 % | |

|
|
| No data | 35,64% - 37,46% | 37,47% - 39,29% | 39,30% - 41,12% | 41,13% - 42,95% | 42,96% - 44,78% | 44,79% - 46,61% | 46,62% - 48,44% | 48,45% - 50,27% | 50,28% - 52,10% | 52,11% - 53,93% |
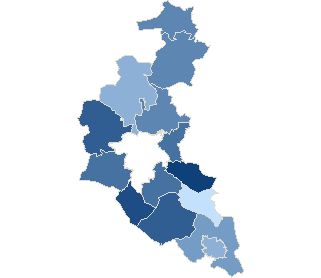
County rzeszowskiSejm constituency no. 23,
| County rzeszowski | |
| Statistic on 09.10.2011 | |
| Inhabitants: | 162 688 |
| Summary voting results | |
| Precincts quantity: | 123 |
| Number of precincts which transmitted result data: | 123 |
| Electors: | 127 249 |
| Number of valid ballot cards: | 63 625 |
| 50.00 % | |
|
|
|
| No data | 35,64% - 37,46% | 37,47% - 39,29% | 39,30% - 41,12% | 41,13% - 42,95% | 42,96% - 44,78% | 44,79% - 46,61% | 46,62% - 48,44% | 48,45% - 50,27% | 50,28% - 52,10% | 52,11% - 53,93% |
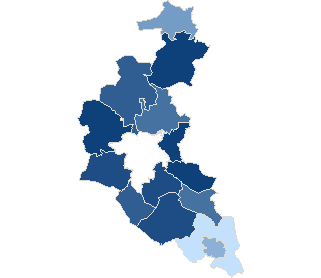
County rzeszowskiSejm constituency no. 23,
| County rzeszowski | |
| Statistic on 09.10.2011 | |
| Inhabitants: | 162 688 |
| Summary voting results | |
| Precincts quantity: | 123 |
| Number of precincts which transmitted result data: | 123 |
| Electors: | 127 249 |
| Number of ballot papers issued: | 6 935 |
| 5.47 % | |
|
|
|
| No data | 2,02% - 2,61% | 2,62% - 3,21% | 3,22% - 3,81% | 3,82% - 4,41% | 4,42% - 5,01% | 5,02% - 5,61% | 5,62% - 6,21% | 6,22% - 6,81% | 6,82% - 7,41% | 7,42% - 8,01% |
County rzeszowskiSejm constituency no. 23,
| County rzeszowski | |
| Statistic on 09.10.2011 | |
| Inhabitants: | 162 688 |
| Summary voting results | |
| Precincts quantity: | 123 |
| Number of precincts which transmitted result data: | 123 |
| Electors: | 127 249 |
| Number of ballot papers issued: | 32 552 |
| 25.62 % | |
|
|
|
| No data | 19,51% - 20,32% | 20,33% - 21,14% | 21,15% - 21,96% | 21,97% - 22,78% | 22,79% - 23,60% | 23,61% - 24,42% | 24,43% - 25,24% | 25,25% - 26,06% | 26,07% - 26,88% | 26,89% - 27,70% |
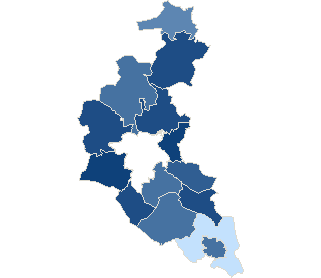
County rzeszowskiSejm constituency no. 23,
| County rzeszowski | |
| Statistic on 09.10.2011 | |
| Inhabitants: | 162 688 |
| Summary voting results | |
| Precincts quantity: | 123 |
| Number of precincts which transmitted result data: | 123 |
| Electors: | 127 249 |
| Number of ballot papers issued: | 53 373 |
| 41.97 % | |
|
|
|
| No data | 29,04% - 30,76% | 30,77% - 32,49% | 32,50% - 34,22% | 34,23% - 35,95% | 35,96% - 37,68% | 37,69% - 39,41% | 39,42% - 41,14% | 41,15% - 42,87% | 42,88% - 44,60% | 44,61% - 46,33% |
| Attendance | ||||||||
| Constituency no. | Teryt | Name | Precincts quantity | Electors | Number of valid ballot cards | Number of valid ballot cards / Electors | ||
| total | which provided data | |||||||
| 23 | 181602 | gm. Błażowa | 9 | 9 | 8528 | 3878 | 45.47 % | |
| 23 | 181603 | gm. Boguchwała | 12 | 12 | 15018 | 8006 | 53.31 % | |
| 23 | 181604 | gm. Chmielnik | 6 | 6 | 5108 | 2536 | 49.65 % | |
| 23 | 181605 | gm. Dynów | 10 | 10 | 5646 | 2012 | 35.64 % | |
| 23 | 181601 | m. Dynów | 5 | 5 | 4995 | 2304 | 46.13 % | |
| 23 | 181606 | gm. Głogów Małopolski | 15 | 15 | 14524 | 7545 | 51.95 % | |
| 23 | 181607 | gm. Hyżne | 8 | 8 | 5402 | 2820 | 52.20 % | |
| 23 | 181608 | gm. Kamień | 5 | 5 | 5416 | 2508 | 46.31 % | |
| 23 | 181609 | gm. Krasne | 6 | 6 | 8032 | 4323 | 53.82 % | |
| 23 | 181610 | gm. Lubenia | 4 | 4 | 5226 | 2531 | 48.43 % | |
| 23 | 181611 | gm. Sokołów Małopolski | 13 | 13 | 13048 | 6560 | 50.28 % | |
| 23 | 181612 | gm. Świlcza | 11 | 11 | 12429 | 6286 | 50.58 % | |
| 23 | 181613 | gm. Trzebownisko | 13 | 13 | 15318 | 8036 | 52.46 % | |
| 23 | 181614 | gm. Tyczyn | 6 | 6 | 8559 | 4262 | 49.80 % | |
| Attendance by level types | |||||||
| No. | Description | Precincts quantity | Electors | Number of valid ballot cards | Number of valid ballot cards / Electors | ||
| total | which provided data | ||||||
| 1 | city | 5 | 5 | 4 995 | 2 304 | 46.13 % | |
| 2 | village | 63 | 63 | 62 577 | 31 052 | 49.62 % | |
| 3 | urban-rural area | 55 | 55 | 59 677 | 30 251 | 50.69 % | |
| Maximum attendance | ||||||||
| Code | Level | Name | Precincts quantity | Electors | Number of valid ballot cards | Number of valid ballot cards / Electors | ||
| total | which provided data | |||||||
| 181609 | Commune | gm. Krasne | 6 | 6 | 8 032 | 4 323 | 53.82 % | |
| Minimum attendance | ||||||||
| Code | Level | Name | Precincts quantity | Electors | Number of valid ballot cards | Number of valid ballot cards / Electors | ||
| total | which provided data | |||||||
| 181605 | Commune | gm. Dynów | 10 | 10 | 5 646 | 2 012 | 35.64 % | |
- Information service info.pkw.gov.pl
- Copyright © 2011 KBW
- Contact:helpdesk@kbw.gov.pl
- Infoline: 801-081-555
- Last modification date: 10-11-2011 21:03:27
