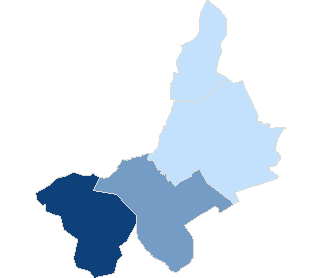
County tarnobrzeskiSejm constituency no. 23,
| County tarnobrzeski | |
| Statistic on 09.10.2011 | |
| Inhabitants: | 54 699 |
| Summary voting results | |
| Precincts quantity: | 45 |
| Number of precincts which transmitted result data: | 45 |
| Electors: | 43 928 |
| Number of valid ballot cards: | 18 882 |
| 42.98 % | |

|
|
| No data | 40,02% - 40,79% | 40,80% - 41,57% | 41,58% - 42,35% | 42,36% - 43,13% | 43,14% - 43,91% | 43,92% - 44,69% | 44,70% - 45,47% | 45,48% - 46,25% | 46,26% - 47,03% | 47,04% - 47,81% |
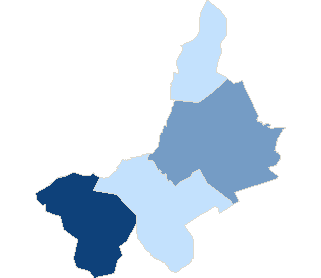
County tarnobrzeskiSejm constituency no. 23,

| County tarnobrzeski | |
| Statistic on 09.10.2011 | |
| Inhabitants: | 54 699 |
| Summary voting results | |
| Precincts quantity: | 45 |
| Number of precincts which transmitted result data: | 45 |
| Electors: | 43 928 |
| Number of valid ballot cards: | 18 874 |
| 42.97 % | |
|
|
|
| No data | 40,02% - 40,79% | 40,80% - 41,57% | 41,58% - 42,35% | 42,36% - 43,13% | 43,14% - 43,91% | 43,92% - 44,69% | 44,70% - 45,47% | 45,48% - 46,25% | 46,26% - 47,03% | 47,04% - 47,81% |
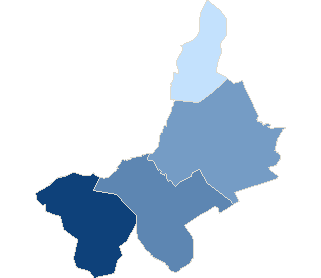
County tarnobrzeskiSejm constituency no. 23,
| County tarnobrzeski | |
| Statistic on 09.10.2011 | |
| Inhabitants: | 54 699 |
| Summary voting results | |
| Precincts quantity: | 45 |
| Number of precincts which transmitted result data: | 45 |
| Electors: | 43 928 |
| Number of ballot papers issued: | 1 479 |
| 3.38 % | |
|
|
|
| No data | 2,57% - 2,83% | 2,84% - 3,10% | 3,11% - 3,37% | 3,38% - 3,64% | 3,65% - 3,91% | 3,92% - 4,18% | 4,19% - 4,45% | 4,46% - 4,72% | 4,73% - 4,99% | 5,00% - 5,26% |
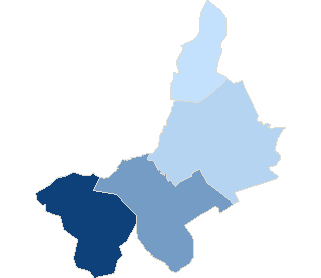
County tarnobrzeskiSejm constituency no. 23,
| County tarnobrzeski | |
| Statistic on 09.10.2011 | |
| Inhabitants: | 54 699 |
| Summary voting results | |
| Precincts quantity: | 45 |
| Number of precincts which transmitted result data: | 45 |
| Electors: | 43 928 |
| Number of ballot papers issued: | 9 165 |
| 20.91 % | |
|
|
|
| No data | 17,34% - 18,08% | 18,09% - 18,83% | 18,84% - 19,58% | 19,59% - 20,33% | 20,34% - 21,08% | 21,09% - 21,83% | 21,84% - 22,58% | 22,59% - 23,33% | 23,34% - 24,08% | 24,09% - 24,83% |
County tarnobrzeskiSejm constituency no. 23,
| County tarnobrzeski | |
| Statistic on 09.10.2011 | |
| Inhabitants: | 54 699 |
| Summary voting results | |
| Precincts quantity: | 45 |
| Number of precincts which transmitted result data: | 45 |
| Electors: | 43 928 |
| Number of ballot papers issued: | 15 721 |
| 35.84 % | |
|
|
|
| No data | 32,37% - 33,24% | 33,25% - 34,12% | 34,13% - 35,00% | 35,01% - 35,88% | 35,89% - 36,76% | 36,77% - 37,64% | 37,65% - 38,52% | 38,53% - 39,40% | 39,41% - 40,28% | 40,29% - 41,16% |
| Attendance | ||||||||
| Constituency no. | Teryt | Name | Precincts quantity | Electors | Number of valid ballot cards | Number of valid ballot cards / Electors | ||
| total | which provided data | |||||||
| 23 | 182001 | gm. Baranów Sandomierski | 9 | 9 | 9697 | 4631 | 47.76 % | |
| 23 | 182002 | gm. Gorzyce | 11 | 11 | 10902 | 4363 | 40.02 % | |
| 23 | 182003 | gm. Grębów | 8 | 8 | 7736 | 3140 | 40.59 % | |
| 23 | 182004 | gm. Nowa Dęba | 17 | 17 | 15593 | 6748 | 43.28 % | |
| Attendance by level types | |||||||
| No. | Description | Precincts quantity | Electors | Number of valid ballot cards | Number of valid ballot cards / Electors | ||
| total | which provided data | ||||||
| 1 | village | 19 | 19 | 18 638 | 7 503 | 40.26 % | |
| 2 | urban-rural area | 26 | 26 | 25 290 | 11 379 | 44.99 % | |
| Maximum attendance | ||||||||
| Code | Level | Name | Precincts quantity | Electors | Number of valid ballot cards | Number of valid ballot cards / Electors | ||
| total | which provided data | |||||||
| 182001 | Commune | gm. Baranów Sandomierski | 9 | 9 | 9 697 | 4 631 | 47.76 % | |
| Minimum attendance | ||||||||
| Code | Level | Name | Precincts quantity | Electors | Number of valid ballot cards | Number of valid ballot cards / Electors | ||
| total | which provided data | |||||||
| 182002 | Commune | gm. Gorzyce | 11 | 11 | 10 902 | 4 363 | 40.02 % | |
- Information service info.pkw.gov.pl
- Copyright © 2011 KBW
- Contact:helpdesk@kbw.gov.pl
- Infoline: 801-081-555
- Last modification date: 10-11-2011 21:03:27
