County bialskiSejm constituency no. 7,
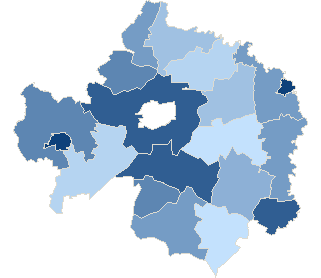
| No data | 37,43% - 38,75% | 38,76% - 40,08% | 40,09% - 41,41% | 41,42% - 42,74% | 42,75% - 44,07% | 44,08% - 45,40% | 45,41% - 46,73% | 46,74% - 48,06% | 48,07% - 49,39% | 49,40% - 50,72% |
County bialskiSejm constituency no. 7,
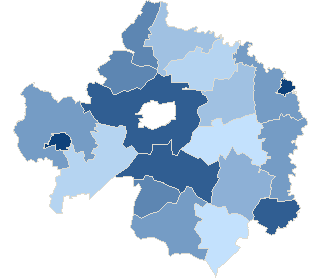
| No data | 37,48% - 38,79% | 38,80% - 40,11% | 40,12% - 41,43% | 41,44% - 42,75% | 42,76% - 44,07% | 44,08% - 45,39% | 45,40% - 46,71% | 46,72% - 48,03% | 48,04% - 49,35% | 49,36% - 50,67% |
County bialskiSejm constituency no. 7,
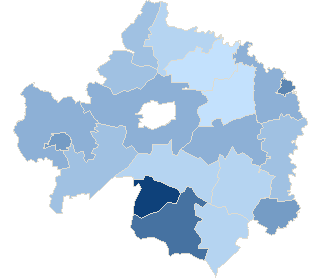
| No data | 0,93% - 1,51% | 1,52% - 2,10% | 2,11% - 2,69% | 2,70% - 3,28% | 3,29% - 3,87% | 3,88% - 4,46% | 4,47% - 5,05% | 5,06% - 5,64% | 5,65% - 6,23% | 6,24% - 6,82% |
County bialskiSejm constituency no. 7,
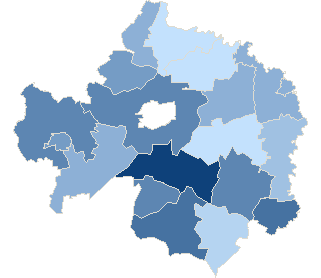
| No data | 21,13% - 21,90% | 21,91% - 22,68% | 22,69% - 23,46% | 23,47% - 24,24% | 24,25% - 25,02% | 25,03% - 25,80% | 25,81% - 26,58% | 26,59% - 27,36% | 27,37% - 28,14% | 28,15% - 28,92% |
County bialskiSejm constituency no. 7,
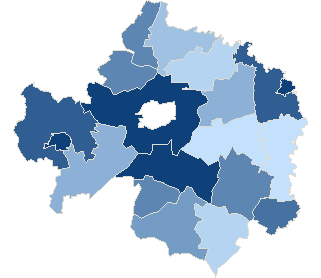
| No data | 31,99% - 32,92% | 32,93% - 33,86% | 33,87% - 34,79% | 34,80% - 35,72% | 35,73% - 36,65% | 36,66% - 37,58% | 37,59% - 38,52% | 38,53% - 39,46% | 39,47% - 40,39% | 40,40% - 41,32% |
| Attendance | ||||||||
| Constituency no. | Teryt | Name | Precincts quantity | Electors | Number of valid ballot cards | Number of valid ballot cards / Electors | ||
| total | which provided data | |||||||
| 7 | 060103 | gm. Biała Podlaska | 15 | 15 | 10198 | 4844 | 47.50 % | |
| 7 | 060104 | gm. Drelów | 5 | 5 | 4389 | 1717 | 39.12 % | |
| 7 | 060105 | gm. Janów Podlaski | 5 | 5 | 4400 | 1816 | 41.27 % | |
| 7 | 060106 | gm. Kodeń | 5 | 5 | 3181 | 1401 | 44.04 % | |
| 7 | 060107 | gm. Konstantynów | 4 | 4 | 3300 | 1452 | 44.00 % | |
| 7 | 060108 | gm. Leśna Podlaska | 4 | 4 | 3463 | 1542 | 44.53 % | |
| 7 | 060109 | gm. Łomazy | 7 | 7 | 4261 | 2048 | 48.06 % | |
| 7 | 060101 | m. Międzyrzec Podlaski | 11 | 11 | 13981 | 7077 | 50.62 % | |
| 7 | 060110 | gm. Międzyrzec Podlaski | 10 | 10 | 8019 | 3535 | 44.08 % | |
| 7 | 060111 | gm. Piszczac | 6 | 6 | 5918 | 2226 | 37.61 % | |
| 7 | 060112 | gm. Rokitno | 4 | 4 | 2580 | 1023 | 39.65 % | |
| 7 | 060113 | gm. Rossosz | 2 | 2 | 1924 | 867 | 45.06 % | |
| 7 | 060114 | gm. Sławatycze | 3 | 3 | 2103 | 984 | 46.79 % | |
| 7 | 060115 | gm. Sosnówka | 3 | 3 | 2252 | 843 | 37.43 % | |
| 7 | 060116 | gm. Terespol | 9 | 9 | 5561 | 2443 | 43.93 % | |
| 7 | 060102 | m. Terespol | 3 | 3 | 4678 | 2364 | 50.53 % | |
| 7 | 060117 | gm. Tuczna | 3 | 3 | 2813 | 1170 | 41.59 % | |
| 7 | 060118 | gm. Wisznice | 5 | 5 | 4265 | 1868 | 43.80 % | |
| 7 | 060119 | gm. Zalesie | 5 | 5 | 3566 | 1453 | 40.75 % | |
| Attendance by level types | |||||||
| No. | Description | Precincts quantity | Electors | Number of valid ballot cards | Number of valid ballot cards / Electors | ||
| total | which provided data | ||||||
| 1 | city | 14 | 14 | 18 659 | 9 441 | 50.60 % | |
| 2 | village | 95 | 95 | 72 193 | 31 232 | 43.26 % | |
| Maximum attendance | ||||||||
| Code | Level | Name | Precincts quantity | Electors | Number of valid ballot cards | Number of valid ballot cards / Electors | ||
| total | which provided data | |||||||
| 060101 | Commune | m. Międzyrzec Podlaski | 11 | 11 | 13 981 | 7 077 | 50.62 % | |
| Minimum attendance | ||||||||
| Code | Level | Name | Precincts quantity | Electors | Number of valid ballot cards | Number of valid ballot cards / Electors | ||
| total | which provided data | |||||||
| 060115 | Commune | gm. Sosnówka | 3 | 3 | 2 252 | 843 | 37.43 % | |

