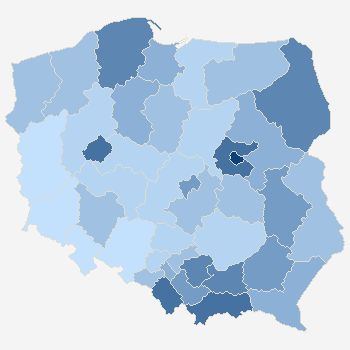
Poland
| Poland | |
| Statistic on 09.10.2011 | |
| Inhabitants: | 37 748 288 |
| Area: | 312 685 km2 |
| Population: | 121 os/km2 |
| Summary voting results | |
| Precincts quantity: | 25 993 |
| Number of precincts which transmitted result data: | 25 993 |
| Electors: | 30 762 931 |
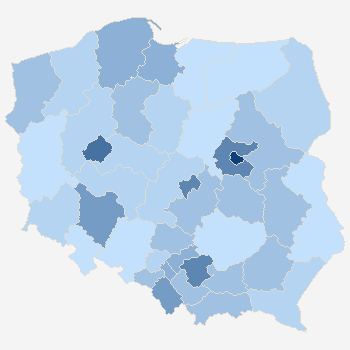
| Number of valid ballot cards: | 15 050 027 |
| 48.92 % | |
 | |
| No data | 40,95% - 43,80% | 43,81% - 46,66% | 46,67% - 49,52% | 49,53% - 52,38% | 52,39% - 55,24% | 55,25% - 58,10% | 58,11% - 60,96% | 60,97% - 63,82% | 63,83% - 66,68% | 66,69% - 69,54% |
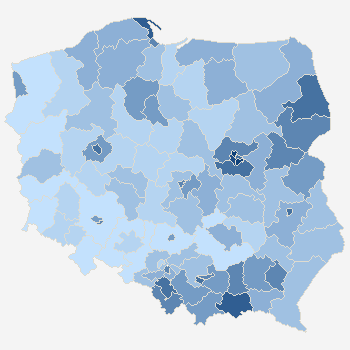
Poland
| Poland | |
| Statistic on 09.10.2011 | |
| Inhabitants: | 37 748 288 |
| Area: | 312 685 km2 |
| Population: | 121 os/km2 |
| Summary voting results | |
| Precincts quantity: | 25 993 |
| Number of precincts which transmitted result data: | 25 993 |
| Electors: | 30 762 931 |
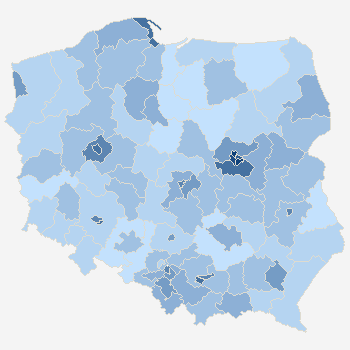
| Number of valid ballot cards: | 15 048 260 |
| 48.92 % | |
| | |
| No data | 38,10% - 41,66% | 41,67% - 45,23% | 45,24% - 48,80% | 48,81% - 52,37% | 52,38% - 55,94% | 55,95% - 59,51% | 59,52% - 63,08% | 63,09% - 66,65% | 66,66% - 70,22% | 70,23% - 73,79% |
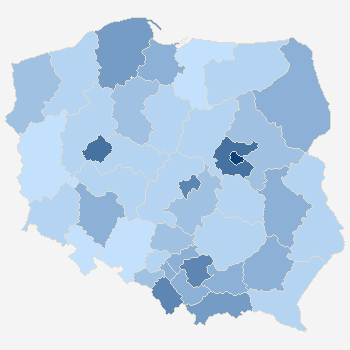
Poland
| Poland | |
| Statistic on 09.10.2011 | |
| Inhabitants: | 37 748 288 |
| Area: | 312 685 km2 |
| Population: | 121 os/km2 |
| Summary voting results | |
| Precincts quantity: | 25 993 |
| Number of precincts which transmitted result data: | 25 722 |
| Electors: | 30 762 931 |
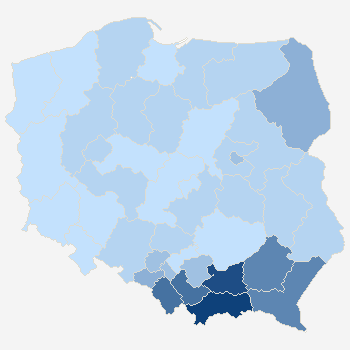
| Number of ballot papers issued: | 848 840 |
| 2.79 % | |
| | |
| No data | 2,00% - 2,38% | 2,39% - 2,77% | 2,78% - 3,16% | 3,17% - 3,55% | 3,56% - 3,94% | 3,95% - 4,33% | 4,34% - 4,72% | 4,73% - 5,11% | 5,12% - 5,50% | 5,51% - 5,89% |
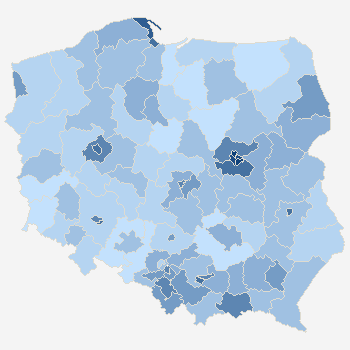
Poland
| Poland | |
| Statistic on 09.10.2011 | |
| Inhabitants: | 37 748 288 |
| Area: | 312 685 km2 |
| Population: | 121 os/km2 |
| Summary voting results | |
| Precincts quantity: | 25 993 |
| Number of precincts which transmitted result data: | 25 722 |
| Electors: | 30 762 931 |
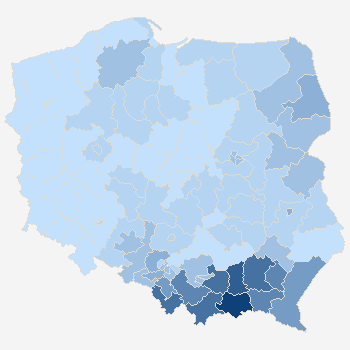
| Number of ballot papers issued: | 848 840 |
| 2.79 % | |
| | |
| No data | 1,85% - 2,32% | 2,33% - 2,80% | 2,81% - 3,28% | 3,29% - 3,76% | 3,77% - 4,24% | 4,25% - 4,72% | 4,73% - 5,20% | 5,21% - 5,68% | 5,69% - 6,16% | 6,17% - 6,64% |
Poland
| Poland | |
| Statistic on 09.10.2011 | |
| Inhabitants: | 37 748 288 |
| Area: | 312 685 km2 |
| Population: | 121 os/km2 |
| Summary voting results | |
| Precincts quantity: | 25 993 |
| Number of precincts which transmitted result data: | 25 722 |
| Electors: | 30 762 931 |
| Number of ballot papers issued: | 7 024 917 |
| 23.03 % | |
| | |
| No data | 18,65% - 19,92% | 19,93% - 21,20% | 21,21% - 22,48% | 22,49% - 23,76% | 23,77% - 25,04% | 25,05% - 26,32% | 26,33% - 27,60% | 27,61% - 28,88% | 28,89% - 30,16% | 30,17% - 31,44% |
Poland
| Poland | |
| Statistic on 09.10.2011 | |
| Inhabitants: | 37 748 288 |
| Area: | 312 685 km2 |
| Population: | 121 os/km2 |
| Summary voting results | |
| Precincts quantity: | 25 993 |
| Number of precincts which transmitted result data: | 25 722 |
| Electors: | 30 762 931 |
| Number of ballot papers issued: | 7 024 917 |
| 23.03 % | |
| | |
| No data | 17,41% - 19,02% | 19,03% - 20,64% | 20,65% - 22,26% | 22,27% - 23,88% | 23,89% - 25,50% | 25,51% - 27,12% | 27,13% - 28,74% | 28,75% - 30,36% | 30,37% - 31,98% | 31,99% - 33,60% |
Poland
| Poland | |
| Statistic on 09.10.2011 | |
| Inhabitants: | 37 748 288 |
| Area: | 312 685 km2 |
| Population: | 121 os/km2 |
| Summary voting results | |
| Precincts quantity: | 25 993 |
| Number of precincts which transmitted result data: | 25 722 |
| Electors: | 30 762 931 |
| Number of ballot papers issued: | 12 119 246 |
| 39.65 % | |
| | |
| No data | 33,48% - 35,51% | 35,52% - 37,55% | 37,56% - 39,59% | 39,60% - 41,63% | 41,64% - 43,67% | 43,68% - 45,71% | 45,72% - 47,75% | 47,76% - 49,79% | 49,80% - 51,83% | 51,84% - 53,87% |
Poland
| Poland | |
| Statistic on 09.10.2011 | |
| Inhabitants: | 37 748 288 |
| Area: | 312 685 km2 |
| Population: | 121 os/km2 |
| Summary voting results | |
| Precincts quantity: | 25 993 |
| Number of precincts which transmitted result data: | 25 722 |
| Electors: | 30 762 931 |
| Number of ballot papers issued: | 12 119 246 |
| 39.65 % | |
| | |
| No data | 31,56% - 34,04% | 34,05% - 36,52% | 36,53% - 39,00% | 39,01% - 41,48% | 41,49% - 43,96% | 43,97% - 46,44% | 46,45% - 48,93% | 48,94% - 51,42% | 51,43% - 53,90% | 53,91% - 56,38% |
| Attendance | |||||||
| Constituency no. | City resident OKW | Precincts quantity | Electors | Number of valid ballot cards | Number of valid ballot cards / Electors | ||
| total | which provided data | ||||||
| 1 | Legnica | 683 | 683 | 801 989 | 362 938 | 45.25 % | |
| 2 | Wałbrzych | 487 | 487 | 557 291 | 238 299 | 42.76 % | |
| 3 | Wrocław | 668 | 668 | 980 670 | 514 742 | 52.49 % | |
| 4 | Bydgoszcz | 689 | 689 | 812 579 | 388 194 | 47.77 % | |
| 5 | Toruń | 725 | 725 | 841 167 | 369 030 | 43.87 % | |
| 6 | Lublin | 942 | 942 | 970 089 | 478 336 | 49.31 % | |
| 7 | Chełm | 872 | 872 | 782 685 | 335 668 | 42.89 % | |
| 8 | Zielona Góra | 669 | 669 | 808 014 | 352 884 | 43.67 % | |
| 9 | Łódź | 479 | 479 | 669 264 | 371 723 | 55.54 % | |
| 10 | Piotrków Trybunalski | 507 | 507 | 592 584 | 277 232 | 46.78 % | |
| 11 | Sieradz | 739 | 739 | 794 134 | 359 859 | 45.31 % | |
| 12 | Kraków I | 418 | 418 | 512 929 | 253 022 | 49.33 % | |
| 13 | Kraków II | 775 | 775 | 933 615 | 520 474 | 55.75 % | |
| 14 | Nowy Sącz | 597 | 597 | 604 838 | 294 885 | 48.75 % | |
| 15 | Tarnów | 514 | 514 | 569 156 | 272 978 | 47.96 % | |
| 16 | Płock | 588 | 588 | 674 762 | 292 276 | 43.32 % | |
| 17 | Radom | 519 | 519 | 581 104 | 271 456 | 46.71 % | |
| 18 | Siedlce | 786 | 786 | 762 035 | 360 659 | 47.33 % | |
| 19 | Warszawa I | 1 135 | 1 135 | 1 493 055 | 1 036 786 | 69.44 % | |
| 20 | Warszawa II | 585 | 585 | 804 045 | 465 400 | 57.88 % | |
| 21 | Opole | 814 | 814 | 827 591 | 338 876 | 40.95 % | |
| 22 | Krosno | 755 | 755 | 710 294 | 313 816 | 44.18 % | |
| 23 | Rzeszów | 939 | 939 | 981 103 | 478 311 | 48.75 % | |
| 24 | Białystok | 884 | 884 | 958 856 | 446 510 | 46.57 % | |
| 25 | Gdańsk | 606 | 606 | 829 936 | 433 637 | 52.25 % | |
| 26 | Gdynia | 711 | 711 | 929 393 | 476 033 | 51.22 % | |
| 27 | Bielsko-Biała | 476 | 476 | 610 963 | 325 790 | 53.32 % | |
| 28 | Częstochowa | 416 | 416 | 495 295 | 235 343 | 47.52 % | |
| 29 | Gliwice | 466 | 466 | 634 111 | 292 905 | 46.19 % | |
| 30 | Rybnik | 416 | 416 | 584 310 | 277 478 | 47.49 % | |
| 31 | Katowice | 547 | 547 | 807 624 | 417 945 | 51.75 % | |
| 32 | Sosnowiec | 415 | 415 | 585 638 | 291 221 | 49.73 % | |
| 33 | Kielce | 948 | 948 | 1 045 948 | 457 529 | 43.74 % | |
| 34 | Elbląg | 434 | 434 | 508 898 | 209 866 | 41.24 % | |
| 35 | Olsztyn | 584 | 584 | 637 830 | 276 015 | 43.27 % | |
| 36 | Kalisz | 659 | 659 | 797 470 | 361 019 | 45.27 % | |
| 37 | Konin | 500 | 500 | 616 690 | 280 238 | 45.44 % | |
| 38 | Piła | 497 | 497 | 609 423 | 278 727 | 45.74 % | |
| 39 | Poznań | 486 | 486 | 686 866 | 413 502 | 60.20 % | |
| 40 | Koszalin | 436 | 436 | 521 444 | 229 108 | 43.94 % | |
| 41 | Szczecin | 627 | 627 | 837 243 | 399 317 | 47.69 % | |
| Attendance in cities over 250 000 inhabitants | |||||||
| Teryt | City resident OKW | Precincts quantity | Electors | Number of valid ballot cards | Number of valid ballot cards / Electors | ||
| total | which provided data | ||||||
| 206101 | Białystok | 164 | 164 | 228 579 | 129 502 | 56.66 % | |
| 046101 | Bydgoszcz | 203 | 203 | 287 027 | 160 406 | 55.89 % | |
| 226101 | Gdańsk | 221 | 221 | 360 163 | 220 865 | 61.32 % | |
| 246901 | Katowice | 166 | 166 | 249 350 | 140 218 | 56.23 % | |
| 126101 | Kraków | 467 | 467 | 595 079 | 357 758 | 60.12 % | |
| 066301 | Lublin | 212 | 212 | 276 983 | 160 389 | 57.91 % | |
| 106101 | Łódź | 400 | 400 | 589 701 | 332 189 | 56.33 % | |
| 306401 | Poznań | 303 | 303 | 432 413 | 269 208 | 62.26 % | |
| 326201 | Szczecin | 203 | 203 | 316 217 | 175 102 | 55.37 % | |
| 146501 | Warszawa | 866 | 866 | 1 353 624 | 917 092 | 67.75 % | |
| 026401 | Wrocław | 297 | 297 | 505 199 | 301 892 | 59.76 % | |
| Attendance by level types | |||||||
| No. | Description | Precincts quantity | Electors | Number of valid ballot cards | Number of valid ballot cards / Electors | ||
| total | which provided data | ||||||
| 1 | city | 10 282 | 10 282 | 15 024 277 | 8 191 601 | 54.52 % | |
| 2 | village | 9 079 | 9 079 | 8 589 548 | 3 643 907 | 42.42 % | |
| 3 | urban-rural area | 6 361 | 6 361 | 7 009 571 | 3 094 727 | 44.15 % | |
| 4 | ships | 3 | 3 | 120 | 114 | 95.00 % | |
| 5 | abroad | 268 | 268 | 139 415 | 119 678 | 85.84 % | |
| Maximum attendance | ||||||||
| Code | Level | Name | Precincts quantity | Electors | Number of valid ballot cards | Number of valid ballot cards / Electors | ||
| total | which provided data | |||||||
| okr-19 | Constituency | Sejm constituency no. 19 | 1 135 | 1 135 | 1 493 055 | 1 036 786 | 69.44 % | |
| 146501 | City with county rights | Warszawa | 866 | 866 | 1 353 624 | 917 092 | 67.75 % | |
| 142100 | County | pruszkowski | 76 | 76 | 121 254 | 75 666 | 62.4 % | |
| 146516 | Commune | dz. Wilanów | 13 | 13 | 16 766 | 12 878 | 76.81 % | |
| Minimum attendance | ||||||||
| Code | Level | Name | Precincts quantity | Electors | Number of valid ballot cards | Number of valid ballot cards / Electors | ||
| total | which provided data | |||||||
| okr-21 | Constituency | Sejm constituency no. 21 | 814 | 814 | 827 591 | 338 876 | 40.95 % | |
| 247801 | City with county rights | Zabrze | 91 | 91 | 144 254 | 59 871 | 41.5 % | |
| 260300 | County | kazimierski | 26 | 26 | 29 526 | 9 863 | 33.4 % | |
| 221603 | Commune | gm. Stary Dzierzgoń | 3 | 3 | 3 290 | 759 | 23.07 % | |
| Attendance | |||||||
| Constituency no. | City resident OKW | Precincts quantity | Electors | Number of valid ballot cards | Number of valid ballot cards / Electors | ||
| total | which provided data | ||||||
| 1 | Legnica | 207 | 207 | 232 701 | 97 947 | 42.09 % | |
| 2 | Legnica | 212 | 212 | 238 761 | 107 138 | 44.87 % | |
| 3 | Legnica | 264 | 264 | 330 527 | 157 784 | 47.74 % | |
| 4 | Wałbrzych | 217 | 217 | 276 552 | 119 567 | 43.23 % | |
| 5 | Wałbrzych | 270 | 270 | 280 739 | 118 751 | 42.30 % | |
| 6 | Wrocław | 371 | 371 | 475 471 | 212 941 | 44.79 % | |
| 7 | Wrocław | 139 | 139 | 238 598 | 145 338 | 60.91 % | |
| 8 | Wrocław | 158 | 158 | 266 601 | 156 549 | 58.72 % | |
| 9 | Bydgoszcz | 381 | 381 | 484 224 | 247 123 | 51.03 % | |
| 10 | Bydgoszcz | 308 | 308 | 328 355 | 141 191 | 43.00 % | |
| 11 | Toruń | 226 | 226 | 275 037 | 137 420 | 49.96 % | |
| 12 | Toruń | 226 | 226 | 268 594 | 109 506 | 40.77 % | |
| 13 | Toruń | 273 | 273 | 297 536 | 122 152 | 41.05 % | |
| 14 | Lublin | 389 | 389 | 354 078 | 161 663 | 45.66 % | |
| 15 | Lublin | 341 | 341 | 339 028 | 156 146 | 46.06 % | |
| 16 | Lublin | 212 | 212 | 276 983 | 160 336 | 57.89 % | |
| 17 | Chełm | 225 | 225 | 216 354 | 100 115 | 46.27 % | |
| 18 | Chełm | 255 | 255 | 209 847 | 86 510 | 41.23 % | |
| 19 | Chełm | 392 | 392 | 356 484 | 149 107 | 41.83 % | |
| 20 | Zielona Góra | 203 | 203 | 256 647 | 121 713 | 47.42 % | |
| 21 | Zielona Góra | 270 | 270 | 306 166 | 133 149 | 43.49 % | |
| 22 | Zielona Góra | 196 | 196 | 245 201 | 98 152 | 40.03 % | |
| 23 | Łódź | 239 | 239 | 340 038 | 192 818 | 56.70 % | |
| 24 | Łódź | 240 | 240 | 329 226 | 178 568 | 54.24 % | |
| 25 | Sieradz | 238 | 238 | 229 522 | 96 870 | 42.21 % | |
| 26 | Sieradz | 213 | 213 | 271 729 | 134 328 | 49.43 % | |
| 27 | Sieradz | 288 | 288 | 292 883 | 128 631 | 43.92 % | |
| 28 | Piotrków Trybunalski | 264 | 264 | 321 820 | 149 617 | 46.49 % | |
| 29 | Piotrków Trybunalski | 243 | 243 | 270 764 | 127 519 | 47.10 % | |
| 30 | Kraków I | 418 | 418 | 512 929 | 253 122 | 49.35 % | |
| 31 | Kraków II | 308 | 308 | 338 536 | 162 773 | 48.08 % | |
| 32 | Kraków II | 216 | 216 | 291 711 | 171 030 | 58.63 % | |
| 33 | Kraków II | 251 | 251 | 303 368 | 186 688 | 61.54 % | |
| 34 | Tarnów | 250 | 250 | 275 622 | 132 418 | 48.04 % | |
| 35 | Tarnów | 264 | 264 | 293 534 | 140 554 | 47.88 % | |
| 36 | Nowy Sącz | 291 | 291 | 293 838 | 135 448 | 46.10 % | |
| 37 | Nowy Sącz | 306 | 306 | 311 000 | 159 396 | 51.25 % | |
| 38 | Płock | 336 | 336 | 395 740 | 180 458 | 45.60 % | |
| 39 | Płock | 252 | 252 | 279 022 | 111 796 | 40.07 % | |
| 40 | Warszawa II | 286 | 286 | 396 249 | 221 000 | 55.77 % | |
| 41 | Warszawa II | 299 | 299 | 407 796 | 244 086 | 59.85 % | |
| 42 | Warszawa I | 210 | 210 | 335 504 | 215 750 | 64.31 % | |
| 43 | Warszawa I | 225 | 225 | 363 743 | 258 117 | 70.96 % | |
| 44 | Warszawa I | 481 | 481 | 454 263 | 334 756 | 73.69 % | |
| 45 | Warszawa I | 219 | 219 | 339 545 | 227 371 | 66.96 % | |
| 46 | Siedlce | 344 | 344 | 308 028 | 137 154 | 44.53 % | |
| 47 | Siedlce | 237 | 237 | 255 290 | 125 324 | 49.09 % | |
| 48 | Siedlce | 205 | 205 | 198 717 | 98 138 | 49.39 % | |
| 49 | Radom | 188 | 188 | 194 098 | 88 369 | 45.53 % | |
| 50 | Radom | 331 | 331 | 387 006 | 183 106 | 47.31 % | |
| 51 | Opole | 363 | 363 | 329 139 | 132 845 | 40.36 % | |
| 52 | Opole | 176 | 176 | 206 669 | 94 874 | 45.91 % | |
| 53 | Opole | 275 | 275 | 291 783 | 111 155 | 38.10 % | |
| 54 | Rzeszów | 270 | 270 | 280 585 | 126 319 | 45.02 % | |
| 55 | Rzeszów | 403 | 403 | 370 574 | 174 901 | 47.20 % | |
| 56 | Rzeszów | 266 | 266 | 329 944 | 177 017 | 53.65 % | |
| 57 | Krosno | 279 | 279 | 273 286 | 122 018 | 44.65 % | |
| 58 | Krosno | 476 | 476 | 437 008 | 191 763 | 43.88 % | |
| 59 | Białystok | 362 | 362 | 380 948 | 158 730 | 41.67 % | |
| 60 | Białystok | 330 | 330 | 401 410 | 207 533 | 51.70 % | |
| 61 | Białystok | 192 | 192 | 176 498 | 80 221 | 45.45 % | |
| 62 | Gdynia | 258 | 258 | 351 535 | 171 783 | 48.87 % | |
| 63 | Gdynia | 284 | 284 | 321 042 | 150 387 | 46.84 % | |
| 64 | Gdynia | 169 | 169 | 256 816 | 154 028 | 59.98 % | |
| 65 | Gdańsk | 244 | 244 | 392 512 | 241 998 | 61.65 % | |
| 66 | Gdańsk | 212 | 212 | 259 250 | 119 542 | 46.11 % | |
| 67 | Gdańsk | 150 | 150 | 178 174 | 71 993 | 40.41 % | |
| 68 | Częstochowa | 282 | 282 | 302 080 | 131 748 | 43.61 % | |
| 69 | Częstochowa | 134 | 134 | 193 215 | 103 483 | 53.56 % | |
| 70 | Gliwice | 276 | 276 | 354 114 | 172 406 | 48.69 % | |
| 71 | Gliwice | 190 | 190 | 279 997 | 120 507 | 43.04 % | |
| 72 | Rybnik | 248 | 248 | 337 333 | 154 571 | 45.82 % | |
| 73 | Rybnik | 168 | 168 | 246 977 | 122 903 | 49.76 % | |
| 74 | Katowice | 240 | 240 | 348 054 | 166 406 | 47.81 % | |
| 75 | Katowice | 141 | 141 | 210 220 | 111 304 | 52.95 % | |
| 76 | Sosnowiec | 253 | 253 | 330 211 | 160 816 | 48.70 % | |
| 77 | Sosnowiec | 162 | 162 | 255 427 | 130 385 | 51.05 % | |
| 78 | Bielsko-Biała | 250 | 250 | 349 104 | 192 490 | 55.14 % | |
| 79 | Bielsko-Biała | 226 | 226 | 261 859 | 133 300 | 50.91 % | |
| 80 | Katowice | 166 | 166 | 249 350 | 140 079 | 56.18 % | |
| 81 | Kielce | 375 | 375 | 367 669 | 147 927 | 40.23 % | |
| 82 | Kielce | 317 | 317 | 351 152 | 147 372 | 41.97 % | |
| 83 | Kielce | 256 | 256 | 327 127 | 162 288 | 49.61 % | |
| 84 | Elbląg | 210 | 210 | 264 462 | 112 427 | 42.51 % | |
| 85 | Elbląg | 224 | 224 | 244 436 | 97 548 | 39.91 % | |
| 86 | Olsztyn | 291 | 291 | 313 320 | 148 512 | 47.40 % | |
| 87 | Olsztyn | 293 | 293 | 324 510 | 127 485 | 39.29 % | |
| 88 | Piła | 269 | 269 | 324 002 | 148 065 | 45.70 % | |
| 89 | Piła | 228 | 228 | 285 421 | 130 678 | 45.78 % | |
| 90 | Poznań | 183 | 183 | 254 453 | 144 338 | 56.72 % | |
| 91 | Poznań | 303 | 303 | 432 413 | 268 883 | 62.18 % | |
| 92 | Konin | 244 | 244 | 313 647 | 146 682 | 46.77 % | |
| 93 | Konin | 256 | 256 | 303 043 | 133 560 | 44.07 % | |
| 94 | Kalisz | 212 | 212 | 263 297 | 116 291 | 44.17 % | |
| 95 | Kalisz | 239 | 239 | 277 992 | 126 430 | 45.48 % | |
| 96 | Kalisz | 208 | 208 | 256 181 | 118 297 | 46.18 % | |
| 97 | Szczecin | 239 | 239 | 370 147 | 203 216 | 54.90 % | |
| 98 | Szczecin | 388 | 388 | 467 096 | 196 088 | 41.98 % | |
| 99 | Koszalin | 234 | 234 | 274 488 | 115 939 | 42.24 % | |
| 100 | Koszalin | 202 | 202 | 246 956 | 113 226 | 45.85 % | |
| Attendance in cities over 250 000 inhabitants | |||||||
| Teryt | City resident OKW | Precincts quantity | Electors | Number of valid ballot cards | Number of valid ballot cards / Electors | ||
| total | which provided data | ||||||
| 206101 | Białystok | 164 | 164 | 228 579 | 129 518 | 56.66 % | |
| 046101 | Bydgoszcz | 203 | 203 | 287 027 | 160 438 | 55.90 % | |
| 226101 | Gdańsk | 221 | 221 | 360 163 | 220 783 | 61.30 % | |
| 246901 | Katowice | 166 | 166 | 249 350 | 140 079 | 56.18 % | |
| 126101 | Kraków | 251 | 251 | 303 368 | 186 688 | 61.54 % | |
| 066301 | Lublin | 212 | 212 | 276 983 | 160 336 | 57.89 % | |
| 106101 | Łódź | 161 | 161 | 249 663 | 139 033 | 55.69 % | |
| 306401 | Poznań | 303 | 303 | 432 413 | 268 883 | 62.18 % | |
| 326201 | Szczecin | 203 | 203 | 316 217 | 175 113 | 55.38 % | |
| 146501 | Warszawa | 866 | 866 | 1 353 624 | 916 212 | 67.69 % | |
| 026401 | Wrocław | 158 | 158 | 266 601 | 156 549 | 58.72 % | |
| Attendance by level types | |||||||
| No. | Description | Precincts quantity | Electors | Number of valid ballot cards | Number of valid ballot cards / Electors | ||
| total | which provided data | ||||||
| 1 | city | 9 416 | 9 416 | 13 670 653 | 7 272 985 | 53.20 % | |
| 2 | village | 9 079 | 9 079 | 8 589 548 | 3 644 248 | 42.43 % | |
| 3 | urban-rural area | 6 361 | 6 361 | 7 009 571 | 3 094 935 | 44.15 % | |
| 4 | ships | 3 | 3 | 120 | 114 | 95.00 % | |
| 5 | abroad | 268 | 268 | 139 415 | 119 766 | 85.91 % | |
| Maximum attendance | ||||||||
| Code | Level | Name | Precincts quantity | Electors | Number of valid ballot cards | Number of valid ballot cards / Electors | ||
| total | which provided data | |||||||
| okr-44 | Constituency | Senate constituency no. 44 | 481 | 481 | 454 263 | 334 756 | 73.69 % | |
| 146501 | City with county rights | Warszawa | 866 | 866 | 1 353 624 | 916 212 | 67.69 % | |
| 142100 | County | pruszkowski | 76 | 76 | 121 254 | 75 564 | 62.32 % | |
| 146516 | Commune | dz. Wilanów | 13 | 13 | 16 766 | 12 874 | 76.79 % | |
| Minimum attendance | ||||||||
| Code | Level | Name | Precincts quantity | Electors | Number of valid ballot cards | Number of valid ballot cards / Electors | ||
| total | which provided data | |||||||
| okr-53 | Constituency | Senate constituency no. 53 | 275 | 275 | 291 783 | 111 155 | 38.1 % | |
| 247801 | City with county rights | Zabrze | 91 | 91 | 144 254 | 59 867 | 41.5 % | |
| 260300 | County | kazimierski | 26 | 26 | 29 526 | 9 861 | 33.4 % | |
| 221603 | Commune | gm. Stary Dzierzgoń | 3 | 3 | 3 290 | 761 | 23.13 % | |
| Attendance | |||||||
| Constituency no. | City resident OKW | Precincts quantity | Electors | No. of issued cards | No. of issued cards / Electors | ||
| total | which provided data | ||||||
| 1 | Legnica | 683 | 682 | 798 630 | 16 955 | 2.12 % | |
| 2 | Wałbrzych | 487 | 487 | 554 280 | 11 487 | 2.07 % | |
| 3 | Wrocław | 668 | 668 | 971 957 | 22 087 | 2.27 % | |
| 4 | Bydgoszcz | 689 | 689 | 809 370 | 19 525 | 2.41 % | |
| 5 | Toruń | 725 | 725 | 835 713 | 20 138 | 2.41 % | |
| 6 | Lublin | 942 | 940 | 959 601 | 25 942 | 2.70 % | |
| 7 | Chełm | 872 | 872 | 780 169 | 18 884 | 2.42 % | |
| 8 | Zielona Góra | 669 | 667 | 804 648 | 16 740 | 2.08 % | |
| 9 | Łódź | 479 | 461 | 662 910 | 15 019 | 2.27 % | |
| 10 | Piotrków Trybunalski | 507 | 504 | 590 669 | 15 033 | 2.55 % | |
| 11 | Sieradz | 739 | 739 | 791 140 | 17 833 | 2.25 % | |
| 12 | Kraków I | 418 | 418 | 511 115 | 23 507 | 4.60 % | |
| 13 | Kraków II | 775 | 775 | 935 029 | 27 580 | 2.95 % | |
| 14 | Nowy Sącz | 597 | 596 | 598 677 | 34 976 | 5.84 % | |
| 15 | Tarnów | 514 | 513 | 568 316 | 29 432 | 5.18 % | |
| 16 | Płock | 588 | 588 | 672 980 | 14 753 | 2.19 % | |
| 17 | Radom | 519 | 519 | 579 353 | 14 385 | 2.48 % | |
| 18 | Siedlce | 786 | 786 | 758 835 | 20 451 | 2.70 % | |
| 19 | Warszawa I | 866 | 855 | 1 329 142 | 38 674 | 2.91 % | |
| 20 | Warszawa II | 585 | 578 | 796 018 | 21 143 | 2.66 % | |
| 21 | Opole | 814 | 813 | 823 915 | 22 751 | 2.76 % | |
| 22 | Krosno | 755 | 755 | 706 434 | 29 166 | 4.13 % | |
| 23 | Rzeszów | 939 | 934 | 977 302 | 41 862 | 4.28 % | |
| 24 | Białystok | 884 | 877 | 957 368 | 30 527 | 3.19 % | |
| 25 | Gdańsk | 604 | 604 | 823 264 | 17 407 | 2.11 % | |
| 26 | Gdynia | 711 | 711 | 923 782 | 24 255 | 2.63 % | |
| 27 | Bielsko-Biała | 476 | 476 | 606 940 | 27 041 | 4.46 % | |
| 28 | Częstochowa | 416 | 416 | 493 455 | 12 540 | 2.54 % | |
| 29 | Gliwice | 466 | 466 | 631 824 | 18 422 | 2.92 % | |
| 30 | Rybnik | 416 | 416 | 582 562 | 19 624 | 3.37 % | |
| 31 | Katowice | 547 | 545 | 804 348 | 23 570 | 2.93 % | |
| 32 | Sosnowiec | 415 | 415 | 584 014 | 13 569 | 2.32 % | |
| 33 | Kielce | 948 | 948 | 1 040 241 | 24 075 | 2.31 % | |
| 34 | Elbląg | 434 | 434 | 507 328 | 12 158 | 2.40 % | |
| 35 | Olsztyn | 584 | 584 | 634 510 | 16 360 | 2.58 % | |
| 36 | Kalisz | 659 | 656 | 795 034 | 19 040 | 2.39 % | |
| 37 | Konin | 500 | 500 | 614 418 | 12 809 | 2.08 % | |
| 38 | Piła | 497 | 494 | 606 532 | 14 540 | 2.40 % | |
| 39 | Poznań | 486 | 460 | 679 814 | 16 814 | 2.47 % | |
| 40 | Koszalin | 436 | 433 | 515 335 | 11 140 | 2.16 % | |
| 41 | Szczecin | 627 | 618 | 832 053 | 16 626 | 2.00 % | |
| Attendance in cities over 250 000 inhabitants | |||||||
| Teryt | City resident OKW | Precincts quantity | Electors | Number of ballot papers issued | Number of ballot papers issued / Electors | ||
| total | which provided data | ||||||
| 206101 | Białystok | 164 | 157 | 229 549 | 7 993 | 3.48 % | |
| 046101 | Bydgoszcz | 203 | 203 | 285 205 | 6 670 | 2.34 % | |
| 226101 | Gdańsk | 221 | 221 | 355 841 | 6 588 | 1.85 % | |
| 246901 | Katowice | 166 | 166 | 247 692 | 7 270 | 2.94 % | |
| 126101 | Kraków | 467 | 467 | 597 760 | 17 279 | 2.89 % | |
| 066301 | Lublin | 212 | 211 | 269 001 | 8 907 | 3.31 % | |
| 106101 | Łódź | 400 | 382 | 583 723 | 13 115 | 2.25 % | |
| 306401 | Poznań | 303 | 277 | 426 588 | 10 531 | 2.47 % | |
| 326201 | Szczecin | 203 | 202 | 314 244 | 6 992 | 2.23 % | |
| 146501 | Warszawa | 866 | 855 | 1 329 142 | 38 674 | 2.91 % | |
| 026401 | Wrocław | 297 | 297 | 498 355 | 12 560 | 2.52 % | |
| Attendance by level types | |||||||
| No. | Description | Precincts quantity | Electors | Number of ballot papers issued | Number of ballot papers issued / Electors | ||
| total | which provided data | ||||||
| 1 | city | 10 282 | 10 196 | 14 910 771 | 410 783 | 2.75 % | |
| 2 | village | 9 079 | 9 077 | 8 558 102 | 245 568 | 2.87 % | |
| 3 | urban-rural area | 6 361 | 6 344 | 6 980 152 | 192 489 | 2.76 % | |
| Maximum attendance | ||||||||
| Code | Level | Name | Precincts quantity | Electors | Number of ballot papers issued | Number of ballot papers issued / Electors | ||
| total | which provided data | |||||||
| okr-14 | Constituency | Sejm constituency no. 14 | 597 | 596 | 598 677 | 34 976 | 5.84 % | |
| 126301 | City with county rights | Tarnów | 73 | 73 | 93 187 | 4 346 | 4.66 % | |
| 121000 | County | nowosądecki | 164 | 164 | 155 957 | 11 805 | 7.57 % | |
| 121006 | Commune | gm. Korzenna | 9 | 9 | 10 324 | 1 306 | 12.65 % | |
| Minimum attendance | ||||||||
| Code | Level | Name | Precincts quantity | Electors | Number of ballot papers issued | Number of ballot papers issued / Electors | ||
| total | which provided data | |||||||
| okr-41 | Constituency | Sejm constituency no. 41 | 627 | 618 | 832 053 | 16 626 | 2.0 % | |
| 246501 | City with county rights | Dąbrowa Górnicza | 67 | 67 | 102 684 | 1 783 | 1.74 % | |
| 320600 | County | gryfiński | 56 | 53 | 66 051 | 977 | 1.48 % | |
| 120806 | Commune | gm. Racławice | 3 | 3 | 2 052 | 8 | 0.39 % | |
| Attendance | |||||||
| Constituency no. | City resident OKW | Precincts quantity | Electors | No. of issued cards | No. of issued cards / Electors | ||
| total | which provided data | ||||||
| 1 | Legnica | 207 | 207 | 231 841 | 4 824 | 2.08 % | |
| 2 | Legnica | 212 | 212 | 237 237 | 5 083 | 2.14 % | |
| 3 | Legnica | 264 | 263 | 329 552 | 7 048 | 2.14 % | |
| 4 | Wałbrzych | 217 | 217 | 275 710 | 5 288 | 1.92 % | |
| 5 | Wałbrzych | 270 | 270 | 278 570 | 6 199 | 2.23 % | |
| 6 | Wrocław | 371 | 371 | 473 602 | 9 527 | 2.01 % | |
| 7 | Wrocław | 139 | 139 | 234 562 | 6 467 | 2.76 % | |
| 8 | Wrocław | 158 | 158 | 263 793 | 6 093 | 2.31 % | |
| 9 | Bydgoszcz | 381 | 381 | 481 794 | 11 429 | 2.37 % | |
| 10 | Bydgoszcz | 308 | 308 | 327 576 | 8 096 | 2.47 % | |
| 11 | Toruń | 226 | 226 | 272 640 | 7 179 | 2.63 % | |
| 12 | Toruń | 226 | 226 | 267 575 | 7 004 | 2.62 % | |
| 13 | Toruń | 273 | 273 | 295 498 | 5 955 | 2.02 % | |
| 14 | Lublin | 389 | 389 | 353 309 | 8 536 | 2.42 % | |
| 15 | Lublin | 341 | 340 | 337 291 | 8 499 | 2.52 % | |
| 16 | Lublin | 212 | 211 | 269 001 | 8 907 | 3.31 % | |
| 17 | Chełm | 225 | 225 | 215 550 | 6 326 | 2.93 % | |
| 18 | Chełm | 255 | 255 | 209 239 | 5 007 | 2.39 % | |
| 19 | Chełm | 392 | 392 | 355 380 | 7 551 | 2.12 % | |
| 20 | Zielona Góra | 203 | 203 | 255 582 | 5 813 | 2.27 % | |
| 21 | Zielona Góra | 270 | 268 | 304 685 | 6 182 | 2.03 % | |
| 22 | Zielona Góra | 196 | 196 | 244 381 | 4 745 | 1.94 % | |
| 23 | Łódź | 239 | 227 | 336 578 | 7 197 | 2.14 % | |
| 24 | Łódź | 240 | 234 | 326 332 | 7 822 | 2.40 % | |
| 25 | Sieradz | 238 | 238 | 228 867 | 4 757 | 2.08 % | |
| 26 | Sieradz | 213 | 213 | 270 725 | 5 912 | 2.18 % | |
| 27 | Sieradz | 288 | 288 | 291 548 | 7 164 | 2.46 % | |
| 28 | Piotrków Trybunalski | 264 | 261 | 320 784 | 7 709 | 2.40 % | |
| 29 | Piotrków Trybunalski | 243 | 243 | 269 885 | 7 324 | 2.71 % | |
| 30 | Kraków I | 418 | 418 | 511 115 | 23 507 | 4.60 % | |
| 31 | Kraków II | 308 | 308 | 337 269 | 10 301 | 3.05 % | |
| 32 | Kraków II | 216 | 216 | 276 480 | 7 992 | 2.89 % | |
| 33 | Kraków II | 251 | 251 | 321 280 | 9 287 | 2.89 % | |
| 34 | Tarnów | 250 | 250 | 275 878 | 13 416 | 4.86 % | |
| 35 | Tarnów | 264 | 263 | 292 438 | 16 016 | 5.48 % | |
| 36 | Nowy Sącz | 291 | 290 | 289 891 | 14 875 | 5.13 % | |
| 37 | Nowy Sącz | 306 | 306 | 308 786 | 20 101 | 6.51 % | |
| 38 | Płock | 336 | 336 | 394 567 | 8 969 | 2.27 % | |
| 39 | Płock | 252 | 252 | 278 413 | 5 784 | 2.08 % | |
| 40 | Warszawa II | 286 | 286 | 392 896 | 10 335 | 2.63 % | |
| 41 | Warszawa II | 299 | 292 | 403 122 | 10 808 | 2.68 % | |
| 42 | Warszawa I | 210 | 210 | 331 304 | 9 527 | 2.88 % | |
| 43 | Warszawa I | 225 | 223 | 355 649 | 10 315 | 2.90 % | |
| 44 | Warszawa I | 212 | 211 | 308 822 | 8 857 | 2.87 % | |
| 45 | Warszawa I | 219 | 211 | 333 367 | 9 975 | 2.99 % | |
| 46 | Siedlce | 344 | 344 | 306 776 | 7 330 | 2.39 % | |
| 47 | Siedlce | 237 | 237 | 254 113 | 6 712 | 2.64 % | |
| 48 | Siedlce | 205 | 205 | 197 946 | 6 409 | 3.24 % | |
| 49 | Radom | 188 | 188 | 193 351 | 4 936 | 2.55 % | |
| 50 | Radom | 331 | 331 | 386 002 | 9 449 | 2.45 % | |
| 51 | Opole | 363 | 363 | 328 289 | 8 463 | 2.58 % | |
| 52 | Opole | 176 | 175 | 204 798 | 5 745 | 2.81 % | |
| 53 | Opole | 275 | 275 | 290 828 | 8 543 | 2.94 % | |
| 54 | Rzeszów | 270 | 267 | 279 508 | 8 972 | 3.21 % | |
| 55 | Rzeszów | 403 | 402 | 369 742 | 18 306 | 4.95 % | |
| 56 | Rzeszów | 266 | 265 | 328 052 | 14 584 | 4.45 % | |
| 57 | Krosno | 279 | 279 | 272 207 | 12 638 | 4.64 % | |
| 58 | Krosno | 476 | 476 | 434 227 | 16 528 | 3.81 % | |
| 59 | Białystok | 362 | 362 | 379 665 | 11 529 | 3.04 % | |
| 60 | Białystok | 330 | 323 | 401 846 | 13 961 | 3.47 % | |
| 61 | Białystok | 192 | 192 | 175 857 | 5 037 | 2.86 % | |
| 62 | Gdynia | 258 | 258 | 349 690 | 7 855 | 2.25 % | |
| 63 | Gdynia | 284 | 284 | 319 583 | 9 302 | 2.91 % | |
| 64 | Gdynia | 169 | 169 | 254 509 | 7 098 | 2.79 % | |
| 65 | Gdańsk | 242 | 242 | 387 101 | 7 545 | 1.95 % | |
| 66 | Gdańsk | 212 | 212 | 258 441 | 6 267 | 2.42 % | |
| 67 | Gdańsk | 150 | 150 | 177 722 | 3 595 | 2.02 % | |
| 68 | Częstochowa | 282 | 282 | 301 127 | 7 325 | 2.43 % | |
| 69 | Częstochowa | 134 | 134 | 192 328 | 5 215 | 2.71 % | |
| 70 | Gliwice | 276 | 276 | 352 630 | 11 702 | 3.32 % | |
| 71 | Gliwice | 190 | 190 | 279 194 | 6 720 | 2.41 % | |
| 72 | Rybnik | 248 | 248 | 336 579 | 11 000 | 3.27 % | |
| 73 | Rybnik | 168 | 168 | 245 983 | 8 624 | 3.51 % | |
| 74 | Katowice | 240 | 240 | 347 167 | 9 926 | 2.86 % | |
| 75 | Katowice | 141 | 139 | 209 489 | 6 374 | 3.04 % | |
| 76 | Sosnowiec | 253 | 253 | 329 259 | 7 526 | 2.29 % | |
| 77 | Sosnowiec | 162 | 162 | 254 755 | 6 043 | 2.37 % | |
| 78 | Bielsko-Biała | 250 | 250 | 347 156 | 14 388 | 4.14 % | |
| 79 | Bielsko-Biała | 226 | 226 | 259 784 | 12 653 | 4.87 % | |
| 80 | Katowice | 166 | 166 | 247 692 | 7 270 | 2.94 % | |
| 81 | Kielce | 375 | 375 | 365 766 | 8 302 | 2.27 % | |
| 82 | Kielce | 317 | 317 | 350 167 | 8 192 | 2.34 % | |
| 83 | Kielce | 256 | 256 | 324 308 | 7 581 | 2.34 % | |
| 84 | Elbląg | 210 | 210 | 263 640 | 6 630 | 2.51 % | |
| 85 | Elbląg | 224 | 224 | 243 688 | 5 528 | 2.27 % | |
| 86 | Olsztyn | 291 | 291 | 311 204 | 8 052 | 2.59 % | |
| 87 | Olsztyn | 293 | 293 | 323 306 | 8 308 | 2.57 % | |
| 88 | Piła | 269 | 268 | 322 274 | 8 315 | 2.58 % | |
| 89 | Piła | 228 | 226 | 284 258 | 6 225 | 2.19 % | |
| 90 | Poznań | 183 | 183 | 253 226 | 6 283 | 2.48 % | |
| 91 | Poznań | 303 | 277 | 426 588 | 10 531 | 2.47 % | |
| 92 | Konin | 244 | 244 | 312 613 | 6 752 | 2.16 % | |
| 93 | Konin | 256 | 256 | 301 805 | 6 057 | 2.01 % | |
| 94 | Kalisz | 212 | 212 | 262 575 | 5 374 | 2.05 % | |
| 95 | Kalisz | 239 | 236 | 276 831 | 7 451 | 2.69 % | |
| 96 | Kalisz | 208 | 208 | 255 628 | 6 215 | 2.43 % | |
| 97 | Szczecin | 239 | 238 | 367 920 | 8 061 | 2.19 % | |
| 98 | Szczecin | 388 | 380 | 464 133 | 8 565 | 1.85 % | |
| 99 | Koszalin | 234 | 234 | 272 018 | 5 914 | 2.17 % | |
| 100 | Koszalin | 202 | 199 | 243 317 | 5 226 | 2.15 % | |
| Attendance in cities over 250 000 inhabitants | |||||||
| Teryt | City resident OKW | Precincts quantity | Electors | Number of ballot papers issued | Number of ballot papers issued / Electors | ||
| total | which provided data | ||||||
| 206101 | Białystok | 164 | 157 | 229 549 | 7 993 | 3.48 % | |
| 046101 | Bydgoszcz | 203 | 203 | 285 205 | 6 670 | 2.34 % | |
| 226101 | Gdańsk | 221 | 221 | 355 841 | 6 588 | 1.85 % | |
| 246901 | Katowice | 166 | 166 | 247 692 | 7 270 | 2.94 % | |
| 126101 | Kraków | 467 | 467 | 597 760 | 17 279 | 2.89 % | |
| 066301 | Lublin | 212 | 211 | 269 001 | 8 907 | 3.31 % | |
| 106101 | Łódź | 400 | 382 | 583 723 | 13 115 | 2.25 % | |
| 306401 | Poznań | 303 | 277 | 426 588 | 10 531 | 2.47 % | |
| 326201 | Szczecin | 203 | 202 | 314 244 | 6 992 | 2.23 % | |
| 146501 | Warszawa | 866 | 855 | 1 329 142 | 38 674 | 2.91 % | |
| 026401 | Wrocław | 297 | 297 | 498 355 | 12 560 | 2.52 % | |
| Attendance by level types | |||||||
| No. | Description | Precincts quantity | Electors | Number of ballot papers issued | Number of ballot papers issued / Electors | ||
| total | which provided data | ||||||
| 1 | city | 9 416 | 9 341 | 13 581 629 | 372 109 | 2.74 % | |
| 2 | village | 9 945 | 9 932 | 9 887 244 | 284 242 | 2.87 % | |
| 3 | urban-rural area | 6 361 | 6 344 | 6 980 152 | 192 489 | 2.76 % | |
| Maximum attendance | ||||||||
| Code | Level | Name | Precincts quantity | Electors | Number of ballot papers issued | Number of ballot papers issued / Electors | ||
| total | which provided data | |||||||
| okr-37 | Constituency | Senate constituency no. 37 | 306 | 306 | 308 786 | 20 101 | 6.51 % | |
| 126301 | City with county rights | Tarnów | 73 | 73 | 93 187 | 4 346 | 4.66 % | |
| 121000 | County | nowosądecki | 164 | 164 | 155 957 | 11 805 | 7.57 % | |
| 121006 | Commune | gm. Korzenna | 9 | 9 | 10 324 | 1 306 | 12.65 % | |
| Minimum attendance | ||||||||
| Code | Level | Name | Precincts quantity | Electors | Number of ballot papers issued | Number of ballot papers issued / Electors | ||
| total | which provided data | |||||||
| okr-98 | Constituency | Senate constituency no. 98 | 388 | 380 | 464 133 | 8 565 | 1.85 % | |
| 246501 | City with county rights | Dąbrowa Górnicza | 67 | 67 | 102 684 | 1 783 | 1.74 % | |
| 320600 | County | gryfiński | 56 | 53 | 66 051 | 977 | 1.48 % | |
| 120806 | Commune | gm. Racławice | 3 | 3 | 2 052 | 8 | 0.39 % | |
| Attendance | |||||||
| Constituency no. | City resident OKW | Precincts quantity | Electors | No. of issued cards | No. of issued cards / Electors | ||
| total | which provided data | ||||||
| 1 | Legnica | 683 | 683 | 800 300 | 157 671 | 19.70 % | |
| 2 | Wałbrzych | 487 | 487 | 555 851 | 105 943 | 19.06 % | |
| 3 | Wrocław | 668 | 668 | 975 362 | 214 343 | 21.98 % | |
| 4 | Bydgoszcz | 689 | 688 | 806 760 | 185 465 | 22.99 % | |
| 5 | Toruń | 725 | 725 | 838 623 | 182 972 | 21.82 % | |
| 6 | Lublin | 942 | 942 | 963 418 | 229 608 | 23.83 % | |
| 7 | Chełm | 872 | 872 | 781 287 | 172 323 | 22.06 % | |
| 8 | Zielona Góra | 669 | 669 | 806 039 | 155 327 | 19.27 % | |
| 9 | Łódź | 479 | 479 | 665 988 | 166 217 | 24.96 % | |
| 10 | Piotrków Trybunalski | 507 | 507 | 591 502 | 127 876 | 21.62 % | |
| 11 | Sieradz | 739 | 739 | 791 928 | 162 970 | 20.58 % | |
| 12 | Kraków I | 418 | 418 | 512 296 | 127 558 | 24.90 % | |
| 13 | Kraków II | 775 | 775 | 925 768 | 234 088 | 25.29 % | |
| 14 | Nowy Sącz | 597 | 597 | 602 384 | 165 991 | 27.56 % | |
| 15 | Tarnów | 514 | 513 | 568 530 | 143 631 | 25.26 % | |
| 16 | Płock | 588 | 588 | 673 601 | 141 039 | 20.94 % | |
| 17 | Radom | 519 | 519 | 579 887 | 124 402 | 21.45 % | |
| 18 | Siedlce | 786 | 786 | 760 429 | 178 090 | 23.42 % | |
| 19 | Warszawa I | 866 | 864 | 1 335 910 | 418 959 | 31.36 % | |
| 20 | Warszawa II | 585 | 581 | 799 668 | 212 509 | 26.57 % | |
| 21 | Opole | 814 | 814 | 825 712 | 153 989 | 18.65 % | |
| 22 | Krosno | 755 | 755 | 708 870 | 160 914 | 22.70 % | |
| 23 | Rzeszów | 939 | 936 | 975 871 | 241 110 | 24.71 % | |
| 24 | Białystok | 884 | 884 | 956 786 | 247 248 | 25.84 % | |
| 25 | Gdańsk | 604 | 604 | 826 115 | 196 053 | 23.73 % | |
| 26 | Gdynia | 711 | 711 | 926 307 | 232 806 | 25.13 % | |
| 27 | Bielsko-Biała | 476 | 476 | 608 841 | 165 514 | 27.19 % | |
| 28 | Częstochowa | 416 | 416 | 494 250 | 104 100 | 21.06 % | |
| 29 | Gliwice | 466 | 466 | 632 741 | 129 771 | 20.51 % | |
| 30 | Rybnik | 416 | 416 | 583 393 | 127 490 | 21.85 % | |
| 31 | Katowice | 547 | 547 | 805 681 | 187 855 | 23.32 % | |
| 32 | Sosnowiec | 415 | 415 | 584 511 | 125 367 | 21.45 % | |
| 33 | Kielce | 948 | 948 | 1 041 947 | 212 103 | 20.36 % | |
| 34 | Elbląg | 434 | 433 | 506 027 | 107 298 | 21.20 % | |
| 35 | Olsztyn | 584 | 584 | 635 567 | 142 584 | 22.43 % | |
| 36 | Kalisz | 659 | 659 | 795 867 | 161 272 | 20.26 % | |
| 37 | Konin | 500 | 500 | 615 338 | 122 981 | 19.99 % | |
| 38 | Piła | 497 | 497 | 607 643 | 124 281 | 20.45 % | |
| 39 | Poznań | 486 | 486 | 683 069 | 182 544 | 26.72 % | |
| 40 | Koszalin | 436 | 436 | 517 688 | 110 950 | 21.43 % | |
| 41 | Szczecin | 627 | 627 | 836 014 | 181 705 | 21.73 % | |
| Attendance in cities over 250 000 inhabitants | |||||||
| Teryt | City resident OKW | Precincts quantity | Electors | Number of ballot papers issued | Number of ballot papers issued / Electors | ||
| total | which provided data | ||||||
| 206101 | Białystok | 164 | 164 | 227 819 | 67 778 | 29.75 % | |
| 046101 | Bydgoszcz | 203 | 202 | 281 826 | 77 095 | 27.36 % | |
| 226101 | Gdańsk | 221 | 221 | 357 624 | 94 905 | 26.54 % | |
| 246901 | Katowice | 166 | 166 | 248 368 | 63 616 | 25.61 % | |
| 126101 | Kraków | 467 | 467 | 587 925 | 161 943 | 27.54 % | |
| 066301 | Lublin | 212 | 212 | 271 780 | 75 044 | 27.61 % | |
| 106101 | Łódź | 400 | 400 | 586 668 | 148 976 | 25.39 % | |
| 306401 | Poznań | 303 | 303 | 429 371 | 120 240 | 28.00 % | |
| 326201 | Szczecin | 203 | 203 | 316 717 | 82 105 | 25.92 % | |
| 146501 | Warszawa | 866 | 864 | 1 335 910 | 418 959 | 31.36 % | |
| 026401 | Wrocław | 297 | 297 | 501 063 | 128 548 | 25.66 % | |
| Attendance by level types | |||||||
| No. | Description | Precincts quantity | Electors | Number of ballot papers issued | Number of ballot papers issued / Electors | ||
| total | which provided data | ||||||
| 1 | city | 10 282 | 10 271 | 14 934 922 | 3 782 660 | 25.33 % | |
| 2 | village | 9 079 | 9 079 | 8 573 971 | 1 803 208 | 21.03 % | |
| 3 | urban-rural area | 6 361 | 6 360 | 6 994 876 | 1 439 049 | 20.57 % | |
| Maximum attendance | ||||||||
| Code | Level | Name | Precincts quantity | Electors | Number of ballot papers issued | Number of ballot papers issued / Electors | ||
| total | which provided data | |||||||
| okr-19 | Constituency | Sejm constituency no. 19 | 866 | 864 | 1 335 910 | 418 959 | 31.36 % | |
| 226401 | City with county rights | Sopot | 21 | 21 | 31 701 | 10 480 | 33.06 % | |
| 121000 | County | nowosądecki | 164 | 164 | 156 921 | 48 584 | 30.96 % | |
| 142303 | Commune | gm. Klwów | 4 | 4 | 2 874 | 1 101 | 38.31 % | |
| Minimum attendance | ||||||||
| Code | Level | Name | Precincts quantity | Electors | Number of ballot papers issued | Number of ballot papers issued / Electors | ||
| total | which provided data | |||||||
| okr-21 | Constituency | Sejm constituency no. 21 | 814 | 814 | 825 712 | 153 989 | 18.65 % | |
| 247801 | City with county rights | Zabrze | 91 | 91 | 144 078 | 26 807 | 18.61 % | |
| 020400 | County | górowski | 27 | 27 | 28 888 | 4 112 | 14.23 % | |
| 320204 | Commune | gm. Krzęcin | 2 | 2 | 3 128 | 305 | 9.75 % | |
| Attendance | |||||||
| Constituency no. | City resident OKW | Precincts quantity | Electors | No. of issued cards | No. of issued cards / Electors | ||
| total | which provided data | ||||||
| 1 | Legnica | 207 | 207 | 232 245 | 42 906 | 18.47 % | |
| 2 | Legnica | 212 | 212 | 238 101 | 47 319 | 19.87 % | |
| 3 | Legnica | 264 | 264 | 329 954 | 67 446 | 20.44 % | |
| 4 | Wałbrzych | 217 | 217 | 276 023 | 53 112 | 19.24 % | |
| 5 | Wałbrzych | 270 | 270 | 279 828 | 52 831 | 18.88 % | |
| 6 | Wrocław | 371 | 371 | 474 299 | 85 795 | 18.09 % | |
| 7 | Wrocław | 139 | 139 | 236 266 | 62 779 | 26.57 % | |
| 8 | Wrocław | 158 | 158 | 264 797 | 65 769 | 24.84 % | |
| 9 | Bydgoszcz | 381 | 380 | 478 760 | 118 728 | 24.80 % | |
| 10 | Bydgoszcz | 308 | 308 | 328 000 | 66 737 | 20.35 % | |
| 11 | Toruń | 226 | 226 | 273 712 | 67 701 | 24.73 % | |
| 12 | Toruń | 226 | 226 | 268 088 | 57 404 | 21.41 % | |
| 13 | Toruń | 273 | 273 | 296 823 | 57 867 | 19.50 % | |
| 14 | Lublin | 389 | 389 | 353 463 | 77 938 | 22.05 % | |
| 15 | Lublin | 341 | 341 | 338 175 | 76 626 | 22.66 % | |
| 16 | Lublin | 212 | 212 | 271 780 | 75 044 | 27.61 % | |
| 17 | Chełm | 225 | 225 | 216 006 | 52 677 | 24.39 % | |
| 18 | Chełm | 255 | 255 | 209 532 | 44 121 | 21.06 % | |
| 19 | Chełm | 392 | 392 | 355 749 | 75 525 | 21.23 % | |
| 20 | Zielona Góra | 203 | 203 | 255 782 | 54 769 | 21.41 % | |
| 21 | Zielona Góra | 270 | 270 | 305 509 | 57 941 | 18.97 % | |
| 22 | Zielona Góra | 196 | 196 | 244 748 | 42 617 | 17.41 % | |
| 23 | Łódź | 239 | 239 | 338 512 | 87 428 | 25.83 % | |
| 24 | Łódź | 240 | 240 | 327 476 | 78 789 | 24.06 % | |
| 25 | Sieradz | 238 | 238 | 229 110 | 47 035 | 20.53 % | |
| 26 | Sieradz | 213 | 213 | 271 084 | 59 749 | 22.04 % | |
| 27 | Sieradz | 288 | 288 | 291 734 | 56 186 | 19.26 % | |
| 28 | Piotrków Trybunalski | 264 | 264 | 321 191 | 67 194 | 20.92 % | |
| 29 | Piotrków Trybunalski | 243 | 243 | 270 311 | 60 682 | 22.45 % | |
| 30 | Kraków I | 418 | 418 | 512 296 | 127 558 | 24.90 % | |
| 31 | Kraków II | 308 | 308 | 337 843 | 72 145 | 21.35 % | |
| 32 | Kraków II | 216 | 216 | 288 965 | 78 342 | 27.11 % | |
| 33 | Kraków II | 251 | 251 | 298 960 | 83 601 | 27.96 % | |
| 34 | Tarnów | 250 | 250 | 276 083 | 66 105 | 23.94 % | |
| 35 | Tarnów | 264 | 263 | 292 447 | 77 526 | 26.51 % | |
| 36 | Nowy Sącz | 291 | 291 | 292 337 | 73 771 | 25.23 % | |
| 37 | Nowy Sącz | 306 | 306 | 310 047 | 92 220 | 29.74 % | |
| 38 | Płock | 336 | 336 | 394 850 | 85 912 | 21.76 % | |
| 39 | Płock | 252 | 252 | 278 751 | 55 127 | 19.78 % | |
| 40 | Warszawa II | 286 | 286 | 394 208 | 101 071 | 25.64 % | |
| 41 | Warszawa II | 299 | 295 | 405 460 | 111 438 | 27.48 % | |
| 42 | Warszawa I | 210 | 210 | 332 602 | 94 474 | 28.40 % | |
| 43 | Warszawa I | 225 | 225 | 358 065 | 119 916 | 33.49 % | |
| 44 | Warszawa I | 212 | 210 | 309 207 | 99 931 | 32.32 % | |
| 45 | Warszawa I | 219 | 219 | 336 036 | 104 638 | 31.14 % | |
| 46 | Siedlce | 344 | 344 | 307 321 | 67 863 | 22.08 % | |
| 47 | Siedlce | 237 | 237 | 254 703 | 59 163 | 23.23 % | |
| 48 | Siedlce | 205 | 205 | 198 405 | 51 064 | 25.74 % | |
| 49 | Radom | 188 | 188 | 193 684 | 41 730 | 21.55 % | |
| 50 | Radom | 331 | 331 | 386 203 | 82 672 | 21.41 % | |
| 51 | Opole | 363 | 363 | 328 666 | 60 323 | 18.35 % | |
| 52 | Opole | 176 | 176 | 205 636 | 42 153 | 20.50 % | |
| 53 | Opole | 275 | 275 | 291 410 | 51 513 | 17.68 % | |
| 54 | Rzeszów | 270 | 267 | 277 121 | 60 460 | 21.82 % | |
| 55 | Rzeszów | 403 | 403 | 370 087 | 92 989 | 25.13 % | |
| 56 | Rzeszów | 266 | 266 | 328 663 | 87 661 | 26.67 % | |
| 57 | Krosno | 279 | 279 | 272 781 | 63 993 | 23.46 % | |
| 58 | Krosno | 476 | 476 | 436 089 | 96 921 | 22.23 % | |
| 59 | Białystok | 362 | 362 | 380 260 | 88 068 | 23.16 % | |
| 60 | Białystok | 330 | 330 | 400 307 | 112 809 | 28.18 % | |
| 61 | Białystok | 192 | 192 | 176 219 | 46 371 | 26.31 % | |
| 62 | Gdynia | 258 | 258 | 350 575 | 82 559 | 23.55 % | |
| 63 | Gdynia | 284 | 284 | 320 330 | 74 585 | 23.28 % | |
| 64 | Gdynia | 169 | 169 | 255 402 | 75 662 | 29.62 % | |
| 65 | Gdańsk | 242 | 242 | 389 325 | 105 385 | 27.07 % | |
| 66 | Gdańsk | 212 | 212 | 258 794 | 56 071 | 21.67 % | |
| 67 | Gdańsk | 150 | 150 | 177 996 | 34 597 | 19.44 % | |
| 68 | Częstochowa | 282 | 282 | 301 568 | 57 101 | 18.93 % | |
| 69 | Częstochowa | 134 | 134 | 192 682 | 46 999 | 24.39 % | |
| 70 | Gliwice | 276 | 276 | 353 281 | 75 903 | 21.49 % | |
| 71 | Gliwice | 190 | 190 | 279 460 | 53 868 | 19.28 % | |
| 72 | Rybnik | 248 | 248 | 336 948 | 71 663 | 21.27 % | |
| 73 | Rybnik | 168 | 168 | 246 445 | 55 827 | 22.65 % | |
| 74 | Katowice | 240 | 240 | 347 514 | 74 791 | 21.52 % | |
| 75 | Katowice | 141 | 141 | 209 799 | 49 448 | 23.57 % | |
| 76 | Sosnowiec | 253 | 253 | 329 579 | 69 554 | 21.10 % | |
| 77 | Sosnowiec | 162 | 162 | 254 932 | 55 813 | 21.89 % | |
| 78 | Bielsko-Biała | 250 | 250 | 347 891 | 95 510 | 27.45 % | |
| 79 | Bielsko-Biała | 226 | 226 | 260 950 | 70 004 | 26.83 % | |
| 80 | Katowice | 166 | 166 | 248 368 | 63 616 | 25.61 % | |
| 81 | Kielce | 375 | 375 | 366 690 | 69 654 | 19.00 % | |
| 82 | Kielce | 317 | 317 | 350 552 | 69 852 | 19.93 % | |
| 83 | Kielce | 256 | 256 | 324 705 | 72 597 | 22.36 % | |
| 84 | Elbląg | 210 | 209 | 261 912 | 58 776 | 22.44 % | |
| 85 | Elbląg | 224 | 224 | 244 115 | 48 522 | 19.88 % | |
| 86 | Olsztyn | 291 | 291 | 311 620 | 74 028 | 23.76 % | |
| 87 | Olsztyn | 293 | 293 | 323 947 | 68 556 | 21.16 % | |
| 88 | Piła | 269 | 269 | 322 835 | 68 589 | 21.25 % | |
| 89 | Piła | 228 | 228 | 284 808 | 55 692 | 19.55 % | |
| 90 | Poznań | 183 | 183 | 253 698 | 62 304 | 24.56 % | |
| 91 | Poznań | 303 | 303 | 429 371 | 120 240 | 28.00 % | |
| 92 | Konin | 244 | 244 | 313 069 | 64 575 | 20.63 % | |
| 93 | Konin | 256 | 256 | 302 269 | 58 406 | 19.32 % | |
| 94 | Kalisz | 212 | 212 | 262 870 | 50 891 | 19.36 % | |
| 95 | Kalisz | 239 | 239 | 277 115 | 57 325 | 20.69 % | |
| 96 | Kalisz | 208 | 208 | 255 882 | 53 056 | 20.73 % | |
| 97 | Szczecin | 239 | 239 | 370 507 | 93 972 | 25.36 % | |
| 98 | Szczecin | 388 | 388 | 465 507 | 87 733 | 18.85 % | |
| 99 | Koszalin | 234 | 234 | 272 993 | 54 882 | 20.10 % | |
| 100 | Koszalin | 202 | 202 | 244 695 | 56 068 | 22.91 % | |
| Attendance in cities over 250 000 inhabitants | |||||||
| Teryt | City resident OKW | Precincts quantity | Electors | Number of ballot papers issued | Number of ballot papers issued / Electors | ||
| total | which provided data | ||||||
| 206101 | Białystok | 164 | 164 | 227 819 | 67 778 | 29.75 % | |
| 046101 | Bydgoszcz | 203 | 202 | 281 826 | 77 095 | 27.36 % | |
| 226101 | Gdańsk | 221 | 221 | 357 624 | 94 905 | 26.54 % | |
| 246901 | Katowice | 166 | 166 | 248 368 | 63 616 | 25.61 % | |
| 126101 | Kraków | 467 | 467 | 587 925 | 161 943 | 27.54 % | |
| 066301 | Lublin | 212 | 212 | 271 780 | 75 044 | 27.61 % | |
| 106101 | Łódź | 400 | 400 | 586 668 | 148 976 | 25.39 % | |
| 306401 | Poznań | 303 | 303 | 429 371 | 120 240 | 28.00 % | |
| 326201 | Szczecin | 203 | 203 | 316 717 | 82 105 | 25.92 % | |
| 146501 | Warszawa | 866 | 864 | 1 335 910 | 418 959 | 31.36 % | |
| 026401 | Wrocław | 297 | 297 | 501 063 | 128 548 | 25.66 % | |
| Attendance by level types | |||||||
| No. | Description | Precincts quantity | Electors | Number of ballot papers issued | Number of ballot papers issued / Electors | ||
| total | which provided data | ||||||
| 1 | city | 9 416 | 9 407 | 13 599 012 | 3 363 701 | 24.73 % | |
| 2 | village | 9 945 | 9 943 | 9 909 881 | 2 222 167 | 22.42 % | |
| 3 | urban-rural area | 6 361 | 6 360 | 6 994 876 | 1 439 049 | 20.57 % | |
| Maximum attendance | ||||||||
| Code | Level | Name | Precincts quantity | Electors | Number of ballot papers issued | Number of ballot papers issued / Electors | ||
| total | which provided data | |||||||
| okr-43 | Constituency | Senate constituency no. 43 | 225 | 225 | 358 065 | 119 916 | 33.49 % | |
| 226401 | City with county rights | Sopot | 21 | 21 | 31 701 | 10 480 | 33.06 % | |
| 121000 | County | nowosądecki | 164 | 164 | 156 921 | 48 584 | 30.96 % | |
| 142303 | Commune | gm. Klwów | 4 | 4 | 2 874 | 1 101 | 38.31 % | |
| Minimum attendance | ||||||||
| Code | Level | Name | Precincts quantity | Electors | Number of ballot papers issued | Number of ballot papers issued / Electors | ||
| total | which provided data | |||||||
| okr-22 | Constituency | Senate constituency no. 22 | 196 | 196 | 244 748 | 42 617 | 17.41 % | |
| 247801 | City with county rights | Zabrze | 91 | 91 | 144 078 | 26 807 | 18.61 % | |
| 020400 | County | górowski | 27 | 27 | 28 888 | 4 112 | 14.23 % | |
| 320204 | Commune | gm. Krzęcin | 2 | 2 | 3 128 | 305 | 9.75 % | |
| Attendance | |||||||
| Constituency no. | City resident OKW | Precincts quantity | Electors | No. of issued cards | No. of issued cards / Electors | ||
| total | which provided data | ||||||
| 1 | Legnica | 683 | 683 | 801 287 | 289 605 | 36.14 % | |
| 2 | Wałbrzych | 487 | 487 | 556 721 | 197 511 | 35.48 % | |
| 3 | Wrocław | 668 | 668 | 979 118 | 397 353 | 40.58 % | |
| 4 | Bydgoszcz | 689 | 689 | 809 263 | 310 117 | 38.32 % | |
| 5 | Toruń | 725 | 725 | 840 300 | 304 577 | 36.25 % | |
| 6 | Lublin | 942 | 942 | 965 552 | 390 773 | 40.47 % | |
| 7 | Chełm | 872 | 872 | 782 143 | 281 409 | 35.98 % | |
| 8 | Zielona Góra | 669 | 669 | 807 577 | 286 140 | 35.43 % | |
| 9 | Łódź | 479 | 479 | 667 300 | 293 506 | 43.98 % | |
| 10 | Piotrków Trybunalski | 507 | 507 | 592 173 | 227 625 | 38.44 % | |
| 11 | Sieradz | 739 | 739 | 792 758 | 292 786 | 36.93 % | |
| 12 | Kraków I | 418 | 418 | 512 408 | 213 097 | 41.59 % | |
| 13 | Kraków II | 775 | 775 | 926 713 | 409 217 | 44.16 % | |
| 14 | Nowy Sącz | 597 | 597 | 604 887 | 253 671 | 41.94 % | |
| 15 | Tarnów | 514 | 514 | 568 755 | 230 699 | 40.56 % | |
| 16 | Płock | 588 | 588 | 674 268 | 239 795 | 35.56 % | |
| 17 | Radom | 519 | 519 | 580 789 | 217 936 | 37.52 % | |
| 18 | Siedlce | 786 | 785 | 761 301 | 296 178 | 38.90 % | |
| 19 | Warszawa I | 866 | 865 | 1 345 540 | 723 474 | 53.77 % | |
| 20 | Warszawa II | 585 | 585 | 802 871 | 369 833 | 46.06 % | |
| 21 | Opole | 814 | 814 | 827 016 | 276 917 | 33.48 % | |
| 22 | Krosno | 755 | 755 | 709 999 | 264 805 | 37.30 % | |
| 23 | Rzeszów | 939 | 939 | 979 979 | 396 098 | 40.42 % | |
| 24 | Białystok | 884 | 884 | 957 971 | 379 763 | 39.64 % | |
| 25 | Gdańsk | 604 | 604 | 828 642 | 337 804 | 40.77 % | |
| 26 | Gdynia | 711 | 711 | 927 977 | 388 135 | 41.83 % | |
| 27 | Bielsko-Biała | 476 | 476 | 610 123 | 270 201 | 44.29 % | |
| 28 | Częstochowa | 416 | 416 | 495 060 | 192 219 | 38.83 % | |
| 29 | Gliwice | 466 | 466 | 633 393 | 236 967 | 37.41 % | |
| 30 | Rybnik | 416 | 416 | 584 211 | 230 883 | 39.52 % | |
| 31 | Katowice | 547 | 547 | 806 888 | 334 266 | 41.43 % | |
| 32 | Sosnowiec | 415 | 415 | 585 129 | 232 825 | 39.79 % | |
| 33 | Kielce | 948 | 947 | 1 039 126 | 375 632 | 36.15 % | |
| 34 | Elbląg | 434 | 434 | 508 776 | 174 637 | 34.32 % | |
| 35 | Olsztyn | 584 | 584 | 637 318 | 229 016 | 35.93 % | |
| 36 | Kalisz | 659 | 658 | 796 414 | 287 331 | 36.08 % | |
| 37 | Konin | 500 | 500 | 616 113 | 226 864 | 36.82 % | |
| 38 | Piła | 497 | 497 | 609 016 | 225 076 | 36.96 % | |
| 39 | Poznań | 486 | 486 | 685 921 | 323 768 | 47.20 % | |
| 40 | Koszalin | 436 | 436 | 519 847 | 189 514 | 36.46 % | |
| 41 | Szczecin | 627 | 627 | 837 472 | 321 223 | 38.36 % | |
| Attendance in cities over 250 000 inhabitants | |||||||
| Teryt | City resident OKW | Precincts quantity | Electors | Number of ballot papers issued | Number of ballot papers issued / Electors | ||
| total | which provided data | ||||||
| 206101 | Białystok | 164 | 164 | 228 230 | 109 125 | 47.81 % | |
| 046101 | Bydgoszcz | 203 | 203 | 283 645 | 124 856 | 44.02 % | |
| 226101 | Gdańsk | 221 | 221 | 359 208 | 165 836 | 46.17 % | |
| 246901 | Katowice | 166 | 166 | 249 000 | 110 374 | 44.33 % | |
| 126101 | Kraków | 467 | 467 | 587 573 | 278 451 | 47.39 % | |
| 066301 | Lublin | 212 | 212 | 272 816 | 128 526 | 47.11 % | |
| 106101 | Łódź | 400 | 400 | 587 809 | 262 137 | 44.60 % | |
| 306401 | Poznań | 303 | 303 | 431 837 | 210 177 | 48.67 % | |
| 326201 | Szczecin | 203 | 203 | 316 717 | 140 328 | 44.31 % | |
| 146501 | Warszawa | 866 | 865 | 1 345 540 | 723 474 | 53.77 % | |
| 026401 | Wrocław | 297 | 297 | 504 045 | 230 420 | 45.71 % | |
| Attendance by level types | |||||||
| No. | Description | Precincts quantity | Electors | Number of ballot papers issued | Number of ballot papers issued / Electors | ||
| total | which provided data | ||||||
| 1 | city | 10 282 | 10 278 | 14 978 892 | 6 543 374 | 43.68 % | |
| 2 | village | 9 079 | 9 079 | 8 586 322 | 3 053 171 | 35.56 % | |
| 3 | urban-rural area | 6 361 | 6 361 | 7 002 901 | 2 522 701 | 36.02 % | |
| Maximum attendance | ||||||||
| Code | Level | Name | Precincts quantity | Electors | Number of ballot papers issued | Number of ballot papers issued / Electors | ||
| total | which provided data | |||||||
| okr-19 | Constituency | Sejm constituency no. 19 | 866 | 865 | 1 345 540 | 723 474 | 53.77 % | |
| 146501 | City with county rights | Warszawa | 866 | 865 | 1 345 540 | 723 474 | 53.77 % | |
| 142100 | County | pruszkowski | 76 | 76 | 120 961 | 59 560 | 49.24 % | |
| 146516 | Commune | dz. Wilanów | 13 | 13 | 16 694 | 9 958 | 59.65 % | |
| Minimum attendance | ||||||||
| Code | Level | Name | Precincts quantity | Electors | Number of ballot papers issued | Number of ballot papers issued / Electors | ||
| total | which provided data | |||||||
| okr-21 | Constituency | Sejm constituency no. 21 | 814 | 814 | 827 016 | 276 917 | 33.48 % | |
| 247801 | City with county rights | Zabrze | 91 | 91 | 144 238 | 48 146 | 33.38 % | |
| 041100 | County | radziejowski | 42 | 42 | 34 448 | 9 411 | 27.32 % | |
| 221603 | Commune | gm. Stary Dzierzgoń | 3 | 3 | 3 290 | 652 | 19.82 % | |
| Attendance | |||||||
| Constituency no. | City resident OKW | Precincts quantity | Electors | No. of issued cards | No. of issued cards / Electors | ||
| total | which provided data | ||||||
| 1 | Legnica | 207 | 207 | 232 574 | 78 435 | 33.72 % | |
| 2 | Legnica | 212 | 212 | 238 428 | 86 038 | 36.09 % | |
| 3 | Legnica | 264 | 264 | 330 285 | 125 132 | 37.89 % | |
| 4 | Wałbrzych | 217 | 217 | 276 272 | 101 979 | 36.91 % | |
| 5 | Wałbrzych | 270 | 270 | 280 449 | 95 532 | 34.06 % | |
| 6 | Wrocław | 371 | 371 | 475 073 | 166 933 | 35.14 % | |
| 7 | Wrocław | 139 | 139 | 238 006 | 110 937 | 46.61 % | |
| 8 | Wrocław | 158 | 158 | 266 039 | 119 483 | 44.91 % | |
| 9 | Bydgoszcz | 381 | 381 | 480 981 | 194 882 | 40.52 % | |
| 10 | Bydgoszcz | 308 | 308 | 328 282 | 115 235 | 35.10 % | |
| 11 | Toruń | 226 | 226 | 274 560 | 112 576 | 41.00 % | |
| 12 | Toruń | 226 | 226 | 268 179 | 92 023 | 34.31 % | |
| 13 | Toruń | 273 | 273 | 297 561 | 99 978 | 33.60 % | |
| 14 | Lublin | 389 | 389 | 353 908 | 132 594 | 37.47 % | |
| 15 | Lublin | 341 | 341 | 338 828 | 129 653 | 38.27 % | |
| 16 | Lublin | 212 | 212 | 272 816 | 128 526 | 47.11 % | |
| 17 | Chełm | 225 | 225 | 216 198 | 83 607 | 38.67 % | |
| 18 | Chełm | 255 | 255 | 209 725 | 72 982 | 34.80 % | |
| 19 | Chełm | 392 | 392 | 356 220 | 124 820 | 35.04 % | |
| 20 | Zielona Góra | 203 | 203 | 256 477 | 98 941 | 38.58 % | |
| 21 | Zielona Góra | 270 | 270 | 305 990 | 107 264 | 35.05 % | |
| 22 | Zielona Góra | 196 | 196 | 245 110 | 79 935 | 32.61 % | |
| 23 | Łódź | 239 | 239 | 339 317 | 153 074 | 45.11 % | |
| 24 | Łódź | 240 | 240 | 327 983 | 140 432 | 42.82 % | |
| 25 | Sieradz | 238 | 238 | 229 377 | 80 091 | 34.92 % | |
| 26 | Sieradz | 213 | 213 | 271 457 | 108 189 | 39.85 % | |
| 27 | Sieradz | 288 | 288 | 291 924 | 104 506 | 35.80 % | |
| 28 | Piotrków Trybunalski | 264 | 264 | 321 578 | 122 647 | 38.14 % | |
| 29 | Piotrków Trybunalski | 243 | 243 | 270 595 | 104 978 | 38.80 % | |
| 30 | Kraków I | 418 | 418 | 512 408 | 213 097 | 41.59 % | |
| 31 | Kraków II | 308 | 308 | 339 140 | 130 766 | 38.56 % | |
| 32 | Kraków II | 216 | 216 | 287 683 | 133 598 | 46.44 % | |
| 33 | Kraków II | 251 | 251 | 299 890 | 144 853 | 48.30 % | |
| 34 | Tarnów | 250 | 250 | 275 401 | 110 685 | 40.19 % | |
| 35 | Tarnów | 264 | 264 | 293 354 | 120 014 | 40.91 % | |
| 36 | Nowy Sącz | 291 | 291 | 293 907 | 114 462 | 38.94 % | |
| 37 | Nowy Sącz | 306 | 306 | 310 980 | 139 209 | 44.76 % | |
| 38 | Płock | 336 | 336 | 395 188 | 147 273 | 37.27 % | |
| 39 | Płock | 252 | 252 | 279 080 | 92 522 | 33.15 % | |
| 40 | Warszawa II | 286 | 286 | 395 839 | 176 662 | 44.63 % | |
| 41 | Warszawa II | 299 | 299 | 407 032 | 193 171 | 47.46 % | |
| 42 | Warszawa I | 210 | 210 | 334 683 | 172 537 | 51.55 % | |
| 43 | Warszawa I | 225 | 225 | 360 588 | 203 049 | 56.31 % | |
| 44 | Warszawa I | 212 | 212 | 313 552 | 171 781 | 54.79 % | |
| 45 | Warszawa I | 219 | 218 | 336 717 | 176 107 | 52.30 % | |
| 46 | Siedlce | 344 | 343 | 307 620 | 113 288 | 36.83 % | |
| 47 | Siedlce | 237 | 237 | 255 065 | 101 133 | 39.65 % | |
| 48 | Siedlce | 205 | 205 | 198 616 | 81 757 | 41.16 % | |
| 49 | Radom | 188 | 188 | 193 989 | 71 096 | 36.65 % | |
| 50 | Radom | 331 | 331 | 386 800 | 146 840 | 37.96 % | |
| 51 | Opole | 363 | 363 | 328 931 | 107 771 | 32.76 % | |
| 52 | Opole | 176 | 176 | 206 405 | 77 088 | 37.35 % | |
| 53 | Opole | 275 | 275 | 291 680 | 92 058 | 31.56 % | |
| 54 | Rzeszów | 270 | 270 | 280 303 | 103 132 | 36.79 % | |
| 55 | Rzeszów | 403 | 403 | 370 413 | 148 896 | 40.20 % | |
| 56 | Rzeszów | 266 | 266 | 329 263 | 144 070 | 43.76 % | |
| 57 | Krosno | 279 | 279 | 273 093 | 104 307 | 38.19 % | |
| 58 | Krosno | 476 | 476 | 436 906 | 160 498 | 36.74 % | |
| 59 | Białystok | 362 | 362 | 380 651 | 134 672 | 35.38 % | |
| 60 | Białystok | 330 | 330 | 400 896 | 175 652 | 43.81 % | |
| 61 | Białystok | 192 | 192 | 176 424 | 69 439 | 39.36 % | |
| 62 | Gdynia | 258 | 258 | 351 074 | 138 526 | 39.46 % | |
| 63 | Gdynia | 284 | 284 | 320 820 | 123 123 | 38.38 % | |
| 64 | Gdynia | 169 | 169 | 256 083 | 126 486 | 49.39 % | |
| 65 | Gdańsk | 242 | 242 | 391 424 | 182 647 | 46.66 % | |
| 66 | Gdańsk | 212 | 212 | 259 044 | 95 032 | 36.69 % | |
| 67 | Gdańsk | 150 | 150 | 178 174 | 60 125 | 33.75 % | |
| 68 | Częstochowa | 282 | 282 | 301 995 | 109 421 | 36.23 % | |
| 69 | Częstochowa | 134 | 134 | 193 065 | 82 798 | 42.89 % | |
| 70 | Gliwice | 276 | 276 | 353 509 | 140 110 | 39.63 % | |
| 71 | Gliwice | 190 | 190 | 279 884 | 96 857 | 34.61 % | |
| 72 | Rybnik | 248 | 248 | 337 250 | 128 281 | 38.04 % | |
| 73 | Rybnik | 168 | 168 | 246 961 | 102 602 | 41.55 % | |
| 74 | Katowice | 240 | 240 | 347 855 | 134 132 | 38.56 % | |
| 75 | Katowice | 141 | 141 | 210 033 | 89 760 | 42.74 % | |
| 76 | Sosnowiec | 253 | 253 | 329 928 | 129 241 | 39.17 % | |
| 77 | Sosnowiec | 162 | 162 | 255 201 | 103 584 | 40.59 % | |
| 78 | Bielsko-Biała | 250 | 250 | 348 525 | 158 688 | 45.53 % | |
| 79 | Bielsko-Biała | 226 | 226 | 261 598 | 111 513 | 42.63 % | |
| 80 | Katowice | 166 | 166 | 249 000 | 110 374 | 44.33 % | |
| 81 | Kielce | 375 | 375 | 367 344 | 124 209 | 33.81 % | |
| 82 | Kielce | 317 | 317 | 351 244 | 123 264 | 35.09 % | |
| 83 | Kielce | 256 | 255 | 320 538 | 128 159 | 39.98 % | |
| 84 | Elbląg | 210 | 210 | 264 446 | 93 793 | 35.47 % | |
| 85 | Elbląg | 224 | 224 | 244 330 | 80 844 | 33.09 % | |
| 86 | Olsztyn | 291 | 291 | 313 007 | 121 514 | 38.82 % | |
| 87 | Olsztyn | 293 | 293 | 324 311 | 107 502 | 33.15 % | |
| 88 | Piła | 269 | 269 | 323 811 | 121 936 | 37.66 % | |
| 89 | Piła | 228 | 228 | 285 205 | 103 140 | 36.16 % | |
| 90 | Poznań | 183 | 183 | 254 084 | 113 591 | 44.71 % | |
| 91 | Poznań | 303 | 303 | 431 837 | 210 177 | 48.67 % | |
| 92 | Konin | 244 | 244 | 313 393 | 117 818 | 37.59 % | |
| 93 | Konin | 256 | 256 | 302 720 | 109 046 | 36.02 % | |
| 94 | Kalisz | 212 | 211 | 262 949 | 90 855 | 34.55 % | |
| 95 | Kalisz | 239 | 239 | 277 312 | 100 787 | 36.34 % | |
| 96 | Kalisz | 208 | 208 | 256 153 | 95 689 | 37.36 % | |
| 97 | Szczecin | 239 | 239 | 370 651 | 162 024 | 43.71 % | |
| 98 | Szczecin | 388 | 388 | 466 821 | 159 199 | 34.10 % | |
| 99 | Koszalin | 234 | 234 | 273 871 | 95 690 | 34.94 % | |
| 100 | Koszalin | 202 | 202 | 245 976 | 93 824 | 38.14 % | |
| Attendance in cities over 250 000 inhabitants | |||||||
| Teryt | City resident OKW | Precincts quantity | Electors | Number of ballot papers issued | Number of ballot papers issued / Electors | ||
| total | which provided data | ||||||
| 206101 | Białystok | 164 | 164 | 228 230 | 109 125 | 47.81 % | |
| 046101 | Bydgoszcz | 203 | 203 | 283 645 | 124 856 | 44.02 % | |
| 226101 | Gdańsk | 221 | 221 | 359 208 | 165 836 | 46.17 % | |
| 246901 | Katowice | 166 | 166 | 249 000 | 110 374 | 44.33 % | |
| 126101 | Kraków | 467 | 467 | 587 573 | 278 451 | 47.39 % | |
| 066301 | Lublin | 212 | 212 | 272 816 | 128 526 | 47.11 % | |
| 106101 | Łódź | 400 | 400 | 587 809 | 262 137 | 44.60 % | |
| 306401 | Poznań | 303 | 303 | 431 837 | 210 177 | 48.67 % | |
| 326201 | Szczecin | 203 | 203 | 316 717 | 140 328 | 44.31 % | |
| 146501 | Warszawa | 866 | 865 | 1 345 540 | 723 474 | 53.77 % | |
| 026401 | Wrocław | 297 | 297 | 504 045 | 230 420 | 45.71 % | |
| Attendance by level types | |||||||
| No. | Description | Precincts quantity | Electors | Number of ballot papers issued | Number of ballot papers issued / Electors | ||
| total | which provided data | ||||||
| 1 | city | 9 416 | 9 413 | 13 633 352 | 5 819 900 | 42.69 % | |
| 2 | village | 9 945 | 9 944 | 9 931 862 | 3 776 645 | 38.03 % | |
| 3 | urban-rural area | 6 361 | 6 361 | 7 002 901 | 2 522 701 | 36.02 % | |
| Maximum attendance | ||||||||
| Code | Level | Name | Precincts quantity | Electors | Number of ballot papers issued | Number of ballot papers issued / Electors | ||
| total | which provided data | |||||||
| okr-43 | Constituency | Senate constituency no. 43 | 225 | 225 | 360 588 | 203 049 | 56.31 % | |
| 146501 | City with county rights | Warszawa | 866 | 865 | 1 345 540 | 723 474 | 53.77 % | |
| 142100 | County | pruszkowski | 76 | 76 | 120 961 | 59 560 | 49.24 % | |
| 146516 | Commune | dz. Wilanów | 13 | 13 | 16 694 | 9 958 | 59.65 % | |
| Minimum attendance | ||||||||
| Code | Level | Name | Precincts quantity | Electors | Number of ballot papers issued | Number of ballot papers issued / Electors | ||
| total | which provided data | |||||||
| okr-53 | Constituency | Senate constituency no. 53 | 275 | 275 | 291 680 | 92 058 | 31.56 % | |
| 247801 | City with county rights | Zabrze | 91 | 91 | 144 238 | 48 146 | 33.38 % | |
| 041100 | County | radziejowski | 42 | 42 | 34 448 | 9 411 | 27.32 % | |
| 221603 | Commune | gm. Stary Dzierzgoń | 3 | 3 | 3 290 | 652 | 19.82 % | |
- Information service info.pkw.gov.pl
- Copyright © 2011 KBW
- Contact:helpdesk@kbw.gov.pl
- Infoline: 801-081-555
- Last modification date: 10-11-2011 21:03:27
