County zamojskiSejm constituency no. 7,
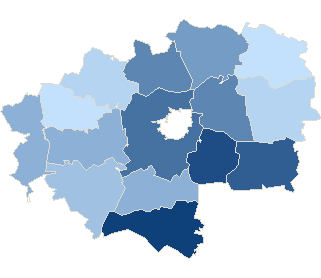
| No data | 32,79% - 34,42% | 34,43% - 36,06% | 36,07% - 37,70% | 37,71% - 39,34% | 39,35% - 40,98% | 40,99% - 42,62% | 42,63% - 44,26% | 44,27% - 45,90% | 45,91% - 47,54% | 47,55% - 49,18% |
County zamojskiSejm constituency no. 7,
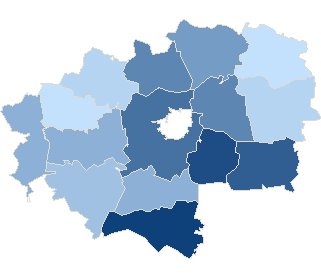
| No data | 32,81% - 34,44% | 34,45% - 36,08% | 36,09% - 37,72% | 37,73% - 39,36% | 39,37% - 41,00% | 41,01% - 42,64% | 42,65% - 44,28% | 44,29% - 45,92% | 45,93% - 47,56% | 47,57% - 49,20% |
County zamojskiSejm constituency no. 7,
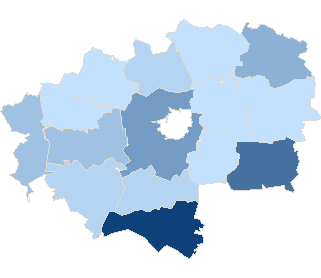
| No data | 1,02% - 1,40% | 1,41% - 1,79% | 1,80% - 2,18% | 2,19% - 2,57% | 2,58% - 2,96% | 2,97% - 3,35% | 3,36% - 3,74% | 3,75% - 4,13% | 4,14% - 4,52% | 4,53% - 4,91% |
County zamojskiSejm constituency no. 7,
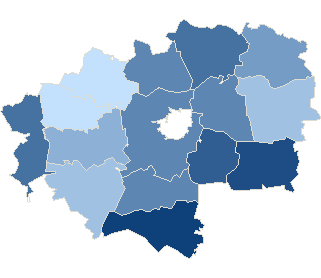
| No data | 14,58% - 15,84% | 15,85% - 17,11% | 17,12% - 18,38% | 18,39% - 19,65% | 19,66% - 20,92% | 20,93% - 22,19% | 22,20% - 23,46% | 23,47% - 24,73% | 24,74% - 26,00% | 26,01% - 27,27% |
County zamojskiSejm constituency no. 7,
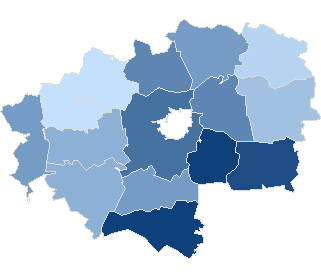
| No data | 27,88% - 29,22% | 29,23% - 30,56% | 30,57% - 31,90% | 31,91% - 33,24% | 33,25% - 34,58% | 34,59% - 35,93% | 35,94% - 37,28% | 37,29% - 38,62% | 38,63% - 39,96% | 39,97% - 41,30% |
| Attendance | ||||||||
| Constituency no. | Teryt | Name | Precincts quantity | Electors | Number of valid ballot cards | Number of valid ballot cards / Electors | ||
| total | which provided data | |||||||
| 7 | 062001 | gm. Adamów | 5 | 5 | 3980 | 1546 | 38.84 % | |
| 7 | 062002 | gm. Grabowiec | 4 | 4 | 3721 | 1220 | 32.79 % | |
| 7 | 062003 | gm. Komarów-Osada | 7 | 7 | 4474 | 2010 | 44.93 % | |
| 7 | 062004 | gm. Krasnobród | 10 | 10 | 5808 | 2854 | 49.14 % | |
| 7 | 062005 | gm. Łabunie | 6 | 6 | 4992 | 2299 | 46.05 % | |
| 7 | 062006 | gm. Miączyn | 8 | 8 | 4927 | 1768 | 35.88 % | |
| 7 | 062007 | gm. Nielisz | 7 | 7 | 4884 | 1687 | 34.54 % | |
| 7 | 062008 | gm. Radecznica | 7 | 7 | 5279 | 2055 | 38.93 % | |
| 7 | 062009 | gm. Sitno | 6 | 6 | 5519 | 2264 | 41.02 % | |
| 7 | 062010 | gm. Skierbieszów | 6 | 6 | 4501 | 1836 | 40.79 % | |
| 7 | 062011 | gm. Stary Zamość | 6 | 6 | 4485 | 1883 | 41.98 % | |
| 7 | 062012 | gm. Sułów | 5 | 5 | 4055 | 1344 | 33.14 % | |
| 7 | 062013 | gm. Szczebrzeszyn | 10 | 10 | 9735 | 3800 | 39.03 % | |
| 7 | 062014 | gm. Zamość | 18 | 18 | 17298 | 7620 | 44.05 % | |
| 7 | 062015 | gm. Zwierzyniec | 5 | 5 | 5853 | 2172 | 37.11 % | |
| Attendance by level types | |||||||
| No. | Description | Precincts quantity | Electors | Number of valid ballot cards | Number of valid ballot cards / Electors | ||
| total | which provided data | ||||||
| 1 | village | 85 | 85 | 68 115 | 27 532 | 40.42 % | |
| 2 | urban-rural area | 25 | 25 | 21 396 | 8 826 | 41.25 % | |
| Maximum attendance | ||||||||
| Code | Level | Name | Precincts quantity | Electors | Number of valid ballot cards | Number of valid ballot cards / Electors | ||
| total | which provided data | |||||||
| 062004 | Commune | gm. Krasnobród | 10 | 10 | 5 808 | 2 854 | 49.14 % | |
| Minimum attendance | ||||||||
| Code | Level | Name | Precincts quantity | Electors | Number of valid ballot cards | Number of valid ballot cards / Electors | ||
| total | which provided data | |||||||
| 062002 | Commune | gm. Grabowiec | 4 | 4 | 3 721 | 1 220 | 32.79 % | |

