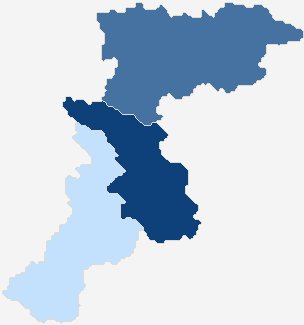
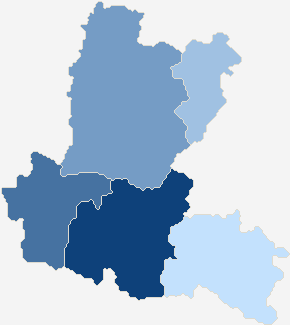
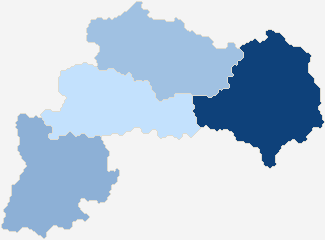
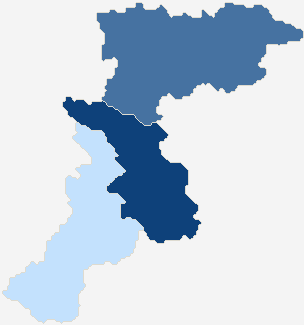
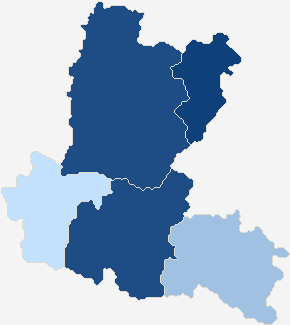
Sejm constituency no. 11
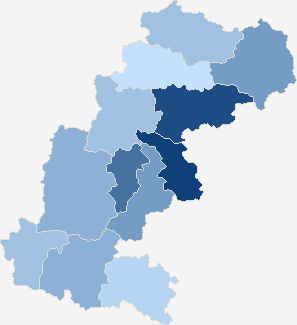
| No data | 38,97% - 40,25% | 40,26% - 41,54% | 41,55% - 42,83% | 42,84% - 44,12% | 44,13% - 45,41% | 45,42% - 46,70% | 46,71% - 47,99% | 48,00% - 49,28% | 49,29% - 50,57% | 50,58% - 51,86% |
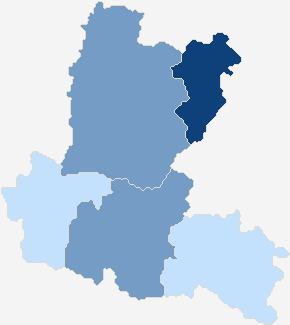
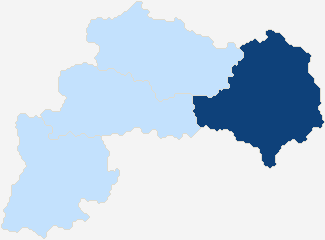
Senate constituency no. 25
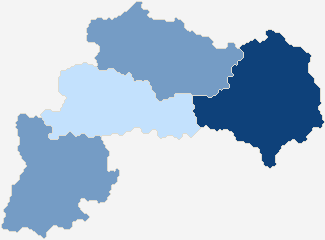
| No data | 38,95% - 39,56% | 39,57% - 40,18% | 40,19% - 40,80% | 40,81% - 41,42% | 41,43% - 42,04% | 42,05% - 42,66% | 42,67% - 43,28% | 43,29% - 43,90% | 43,91% - 44,52% | 44,53% - 45,14% |
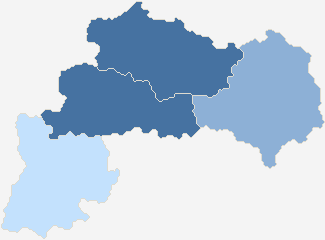
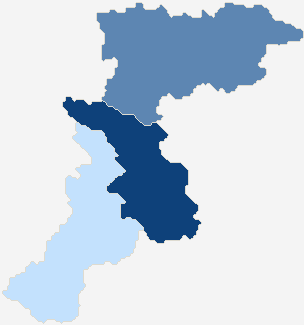
Sejm constituency no. 11
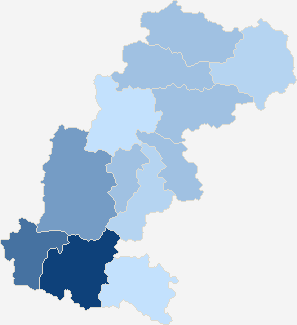
| No data | 1,87% - 1,99% | 2,00% - 2,12% | 2,13% - 2,25% | 2,26% - 2,38% | 2,39% - 2,51% | 2,52% - 2,64% | 2,65% - 2,77% | 2,78% - 2,90% | 2,91% - 3,03% | 3,04% - 3,16% |
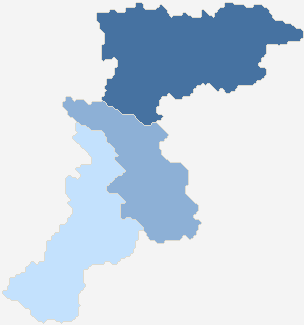
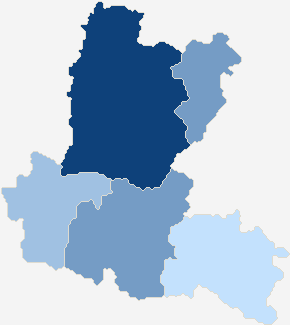
Sejm constituency no. 11
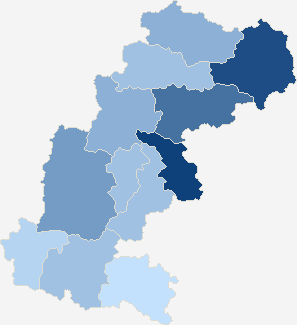
| No data | 17,71% - 18,30% | 18,31% - 18,90% | 18,91% - 19,50% | 19,51% - 20,10% | 20,11% - 20,70% | 20,71% - 21,30% | 21,31% - 21,90% | 21,91% - 22,50% | 22,51% - 23,10% | 23,11% - 23,70% |
Sejm constituency no. 11
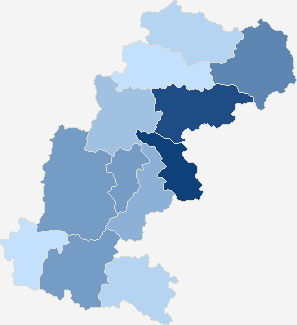
| No data | 32,67% - 33,55% | 33,56% - 34,44% | 34,45% - 35,33% | 35,34% - 36,22% | 36,23% - 37,11% | 37,12% - 38,00% | 38,01% - 38,89% | 38,90% - 39,78% | 39,79% - 40,67% | 40,68% - 41,56% |
| Attendance in counties | ||||||||
| Constituency no. | Teryt | City resident OKW | Precincts quantity | Electors | Number of valid ballot cards | Number of valid ballot cards / Electors | ||
| total | which provided data | |||||||
| 11 | 100200 | pow. kutnowski | 77 | 77 | 84373 | 35258 | 41.79 % | |
| 11 | 100300 | pow. łaski | 39 | 39 | 41412 | 18338 | 44.28 % | |
| 11 | 100400 | pow. łęczycki | 48 | 48 | 43891 | 17103 | 38.97 % | |
| 11 | 100500 | pow. łowicki | 65 | 65 | 66725 | 30013 | 44.98 % | |
| 11 | 100800 | pow. pabianicki | 68 | 68 | 97516 | 50508 | 51.79 % | |
| 11 | 100900 | pow. pajęczański | 39 | 39 | 42992 | 17819 | 41.45 % | |
| 11 | 101100 | pow. poddębicki | 48 | 48 | 34533 | 14470 | 41.90 % | |
| 11 | 101400 | pow. sieradzki | 91 | 91 | 97994 | 43136 | 44.02 % | |
| 11 | 101700 | pow. wieluński | 79 | 79 | 63508 | 27973 | 44.05 % | |
| 11 | 101800 | pow. wieruszowski | 36 | 36 | 33954 | 14108 | 41.55 % | |
| 11 | 101900 | pow. zduńskowolski | 43 | 43 | 54435 | 25667 | 47.15 % | |
| 11 | 102000 | pow. zgierski | 106 | 106 | 132801 | 65466 | 49.30 % | |
| Attendance by level types | |||||||
| No. | Description | Precincts quantity | Electors | Number of valid ballot cards | Number of valid ballot cards / Electors | ||
| total | which provided data | ||||||
| 1 | city | 214 | 214 | 296 096 | 149 081 | 50.35 % | |
| 2 | village | 358 | 358 | 312 217 | 127 198 | 40.74 % | |
| 3 | urban-rural area | 167 | 167 | 185 821 | 83 580 | 44.98 % | |
| Maximum attendance | ||||||||
| Code | Level | Name | Precincts quantity | Electors | Number of valid ballot cards | Number of valid ballot cards / Electors | ||
| total | which provided data | |||||||
| 100807 | Commune | gm. Pabianice | 4 | 4 | 4 920 | 2 665 | 54.17 % | |
| 100800 | County | pabianicki | 68 | 68 | 97 516 | 50 508 | 51.79 % | |
| Minimum attendance | ||||||||
| Code | Level | Name | Precincts quantity | Electors | Number of valid ballot cards | Number of valid ballot cards / Electors | ||
| total | which provided data | |||||||
| 100208 | Commune | gm. Nowe Ostrowy | 4 | 4 | 3 069 | 984 | 32.06 % | |
| 100400 | County | łęczycki | 48 | 48 | 43 891 | 17 103 | 38.97 % | |

