County nowosądeckiSejm constituency no. 14,
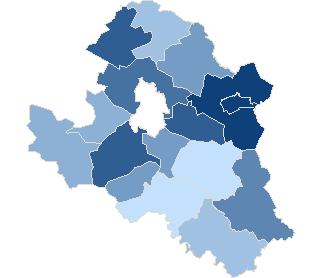
| No data | 44,22% - 45,57% | 45,58% - 46,93% | 46,94% - 48,29% | 48,30% - 49,65% | 49,66% - 51,01% | 51,02% - 52,37% | 52,38% - 53,73% | 53,74% - 55,09% | 55,10% - 56,45% | 56,46% - 57,81% |
County nowosądeckiSejm constituency no. 14,
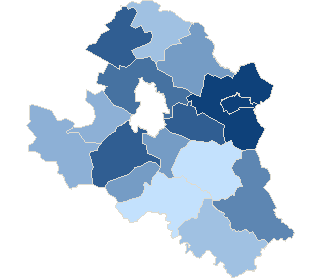
| No data | 44,22% - 45,57% | 45,58% - 46,93% | 46,94% - 48,29% | 48,30% - 49,65% | 49,66% - 51,01% | 51,02% - 52,37% | 52,38% - 53,73% | 53,74% - 55,09% | 55,10% - 56,45% | 56,46% - 57,81% |
County nowosądeckiSejm constituency no. 14,
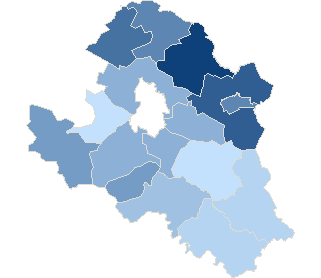
| No data | 3,95% - 4,82% | 4,83% - 5,70% | 5,71% - 6,58% | 6,59% - 7,46% | 7,47% - 8,34% | 8,35% - 9,22% | 9,23% - 10,10% | 10,11% - 10,98% | 10,99% - 11,86% | 11,87% - 12,74% |
County nowosądeckiSejm constituency no. 14,
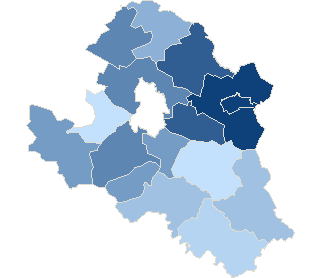
| No data | 24,19% - 25,55% | 25,56% - 26,92% | 26,93% - 28,29% | 28,30% - 29,66% | 29,67% - 31,03% | 31,04% - 32,40% | 32,41% - 33,77% | 33,78% - 35,14% | 35,15% - 36,51% | 36,52% - 37,88% |
County nowosądeckiSejm constituency no. 14,
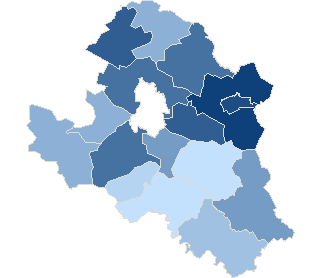
| No data | 37,99% - 39,38% | 39,39% - 40,78% | 40,79% - 42,18% | 42,19% - 43,58% | 43,59% - 44,98% | 44,99% - 46,38% | 46,39% - 47,78% | 47,79% - 49,18% | 49,19% - 50,58% | 50,59% - 51,98% |
| Attendance | ||||||||
| Constituency no. | Teryt | Name | Precincts quantity | Electors | Number of valid ballot cards | Number of valid ballot cards / Electors | ||
| total | which provided data | |||||||
| 14 | 121002 | gm. Chełmiec | 21 | 21 | 19679 | 10505 | 53.38 % | |
| 14 | 121003 | gm. Gródek nad Dunajcem | 7 | 7 | 6751 | 3177 | 47.06 % | |
| 14 | 121001 | m. Grybów | 5 | 5 | 4878 | 2814 | 57.69 % | |
| 14 | 121004 | gm. Grybów | 15 | 15 | 17611 | 10127 | 57.50 % | |
| 14 | 121005 | gm. Kamionka Wielka | 8 | 8 | 7094 | 3815 | 53.78 % | |
| 14 | 121006 | gm. Korzenna | 9 | 9 | 10354 | 5267 | 50.87 % | |
| 14 | 121007 | gm. Krynica-Zdrój | 18 | 18 | 14740 | 7707 | 52.29 % | |
| 14 | 121008 | gm. Łabowa | 5 | 5 | 4028 | 1820 | 45.18 % | |
| 14 | 121009 | gm. Łącko | 12 | 12 | 11706 | 5699 | 48.68 % | |
| 14 | 121010 | gm. Łososina Dolna | 7 | 7 | 7763 | 4224 | 54.41 % | |
| 14 | 121011 | gm. Muszyna | 11 | 11 | 9118 | 4391 | 48.16 % | |
| 14 | 121012 | gm. Nawojowa | 7 | 7 | 5905 | 2945 | 49.87 % | |
| 14 | 121013 | gm. Piwniczna-Zdrój | 8 | 8 | 8344 | 3690 | 44.22 % | |
| 14 | 121014 | gm. Podegrodzie | 14 | 14 | 9013 | 4395 | 48.76 % | |
| 14 | 121015 | gm. Rytro | 2 | 2 | 2956 | 1475 | 49.90 % | |
| 14 | 121016 | gm. Stary Sącz | 15 | 15 | 17564 | 9483 | 53.99 % | |
| Attendance by level types | |||||||
| No. | Description | Precincts quantity | Electors | Number of valid ballot cards | Number of valid ballot cards / Electors | ||
| total | which provided data | ||||||
| 1 | city | 5 | 5 | 4 878 | 2 814 | 57.69 % | |
| 2 | village | 107 | 107 | 102 860 | 53 449 | 51.96 % | |
| 3 | urban-rural area | 52 | 52 | 49 766 | 25 271 | 50.78 % | |
| Maximum attendance | ||||||||
| Code | Level | Name | Precincts quantity | Electors | Number of valid ballot cards | Number of valid ballot cards / Electors | ||
| total | which provided data | |||||||
| 121001 | Commune | m. Grybów | 5 | 5 | 4 878 | 2 814 | 57.69 % | |
| Minimum attendance | ||||||||
| Code | Level | Name | Precincts quantity | Electors | Number of valid ballot cards | Number of valid ballot cards / Electors | ||
| total | which provided data | |||||||
| 121013 | Commune | gm. Piwniczna-Zdrój | 8 | 8 | 8 344 | 3 690 | 44.22 % | |

