County nowotarskiSejm constituency no. 14,
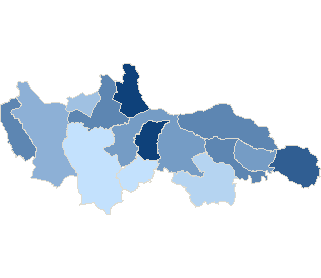
| No data | 34,26% - 35,98% | 35,99% - 37,71% | 37,72% - 39,44% | 39,45% - 41,17% | 41,18% - 42,90% | 42,91% - 44,63% | 44,64% - 46,36% | 46,37% - 48,09% | 48,10% - 49,82% | 49,83% - 51,55% |
County nowotarskiSejm constituency no. 14,
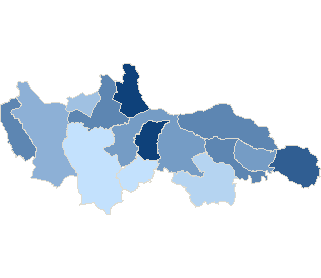
| No data | 34,27% - 35,99% | 36,00% - 37,72% | 37,73% - 39,45% | 39,46% - 41,18% | 41,19% - 42,91% | 42,92% - 44,64% | 44,65% - 46,37% | 46,38% - 48,10% | 48,11% - 49,83% | 49,84% - 51,56% |
County nowotarskiSejm constituency no. 14,
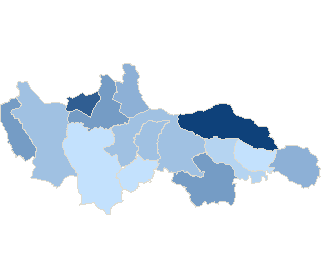
| No data | 2,91% - 3,42% | 3,43% - 3,94% | 3,95% - 4,46% | 4,47% - 4,98% | 4,99% - 5,50% | 5,51% - 6,02% | 6,03% - 6,54% | 6,55% - 7,06% | 7,07% - 7,58% | 7,59% - 8,10% |
County nowotarskiSejm constituency no. 14,
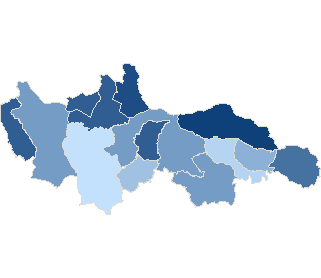
| No data | 16,64% - 17,88% | 17,89% - 19,13% | 19,14% - 20,38% | 20,39% - 21,63% | 21,64% - 22,88% | 22,89% - 24,13% | 24,14% - 25,38% | 25,39% - 26,63% | 26,64% - 27,88% | 27,89% - 29,13% |
County nowotarskiSejm constituency no. 14,
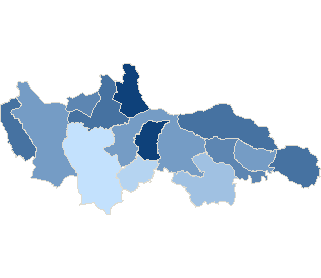
| No data | 28,86% - 30,27% | 30,28% - 31,69% | 31,70% - 33,11% | 33,12% - 34,53% | 34,54% - 35,95% | 35,96% - 37,37% | 37,38% - 38,79% | 38,80% - 40,21% | 40,22% - 41,63% | 41,64% - 43,05% |
| Attendance | ||||||||
| Constituency no. | Teryt | Name | Precincts quantity | Electors | Number of valid ballot cards | Number of valid ballot cards / Electors | ||
| total | which provided data | |||||||
| 14 | 121103 | gm. Czarny Dunajec | 21 | 21 | 16601 | 5688 | 34.26 % | |
| 14 | 121104 | gm. Czorsztyn | 6 | 6 | 5653 | 2486 | 43.98 % | |
| 14 | 121105 | gm. Jabłonka | 11 | 11 | 13314 | 5341 | 40.12 % | |
| 14 | 121106 | gm. Krościenko nad Dunajcem | 6 | 6 | 5241 | 2200 | 41.98 % | |
| 14 | 121107 | gm. Lipnica Wielka | 5 | 5 | 4334 | 1870 | 43.15 % | |
| 14 | 121108 | gm. Łapsze Niżne | 9 | 9 | 6999 | 2582 | 36.89 % | |
| 14 | 121109 | gm. Nowy Targ | 21 | 21 | 17463 | 7237 | 41.44 % | |
| 14 | 121101 | m. Nowy Targ | 18 | 18 | 26619 | 13700 | 51.47 % | |
| 14 | 121110 | gm. Ochotnica Dolna | 4 | 4 | 6166 | 2736 | 44.37 % | |
| 14 | 121111 | gm. Raba Wyżna | 10 | 10 | 10872 | 4704 | 43.27 % | |
| 14 | 121112 | gm. Rabka-Zdrój | 13 | 13 | 14015 | 7134 | 50.90 % | |
| 14 | 121113 | gm. Spytkowice | 3 | 3 | 3175 | 1246 | 39.24 % | |
| 14 | 121114 | gm. Szaflary | 10 | 10 | 7926 | 2846 | 35.91 % | |
| 14 | 121102 | gm. Szczawnica | 6 | 6 | 6221 | 2903 | 46.66 % | |
| Attendance by level types | |||||||
| No. | Description | Precincts quantity | Electors | Number of valid ballot cards | Number of valid ballot cards / Electors | ||
| total | which provided data | ||||||
| 1 | city | 18 | 18 | 26 619 | 13 700 | 51.47 % | |
| 2 | village | 106 | 106 | 97 744 | 38 936 | 39.83 % | |
| 3 | urban-rural area | 19 | 19 | 20 236 | 10 037 | 49.60 % | |
| Maximum attendance | ||||||||
| Code | Level | Name | Precincts quantity | Electors | Number of valid ballot cards | Number of valid ballot cards / Electors | ||
| total | which provided data | |||||||
| 121101 | Commune | m. Nowy Targ | 18 | 18 | 26 619 | 13 700 | 51.47 % | |
| Minimum attendance | ||||||||
| Code | Level | Name | Precincts quantity | Electors | Number of valid ballot cards | Number of valid ballot cards / Electors | ||
| total | which provided data | |||||||
| 121103 | Commune | gm. Czarny Dunajec | 21 | 21 | 16 601 | 5 688 | 34.26 % | |

