County tarnowskiSejm constituency no. 15,
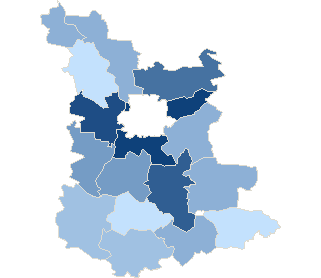
| No data | 40,92% - 42,04% | 42,05% - 43,17% | 43,18% - 44,30% | 44,31% - 45,43% | 45,44% - 46,56% | 46,57% - 47,69% | 47,70% - 48,82% | 48,83% - 49,95% | 49,96% - 51,08% | 51,09% - 52,21% |
County tarnowskiSejm constituency no. 15,
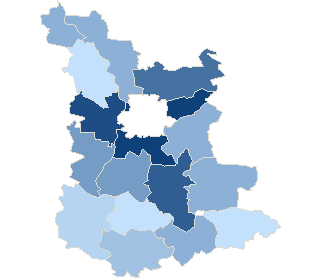
| No data | 40,92% - 42,06% | 42,07% - 43,21% | 43,22% - 44,36% | 44,37% - 45,51% | 45,52% - 46,66% | 46,67% - 47,81% | 47,82% - 48,96% | 48,97% - 50,11% | 50,12% - 51,26% | 51,27% - 52,41% |
County tarnowskiSejm constituency no. 15,
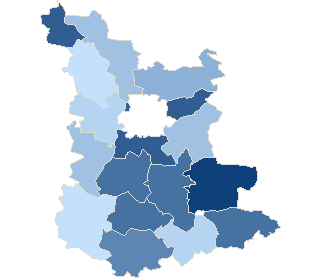
| No data | 3,62% - 4,19% | 4,20% - 4,77% | 4,78% - 5,35% | 5,36% - 5,93% | 5,94% - 6,51% | 6,52% - 7,09% | 7,10% - 7,67% | 7,68% - 8,25% | 8,26% - 8,83% | 8,84% - 9,41% |
County tarnowskiSejm constituency no. 15,
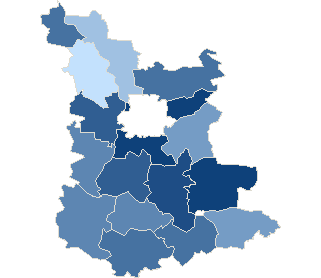
| No data | 19,71% - 20,72% | 20,73% - 21,74% | 21,75% - 22,76% | 22,77% - 23,78% | 23,79% - 24,80% | 24,81% - 25,82% | 25,83% - 26,84% | 26,85% - 27,86% | 27,87% - 28,88% | 28,89% - 29,90% |
County tarnowskiSejm constituency no. 15,
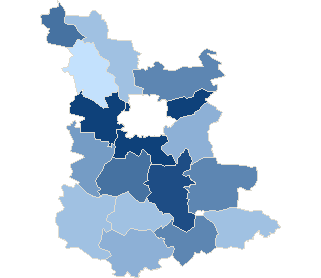
| No data | 35,02% - 35,98% | 35,99% - 36,95% | 36,96% - 37,92% | 37,93% - 38,89% | 38,90% - 39,86% | 39,87% - 40,83% | 40,84% - 41,80% | 41,81% - 42,77% | 42,78% - 43,74% | 43,75% - 44,71% |
| Attendance | ||||||||
| Constituency no. | Teryt | Name | Precincts quantity | Electors | Number of valid ballot cards | Number of valid ballot cards / Electors | ||
| total | which provided data | |||||||
| 15 | 121601 | gm. Ciężkowice | 5 | 5 | 8702 | 3765 | 43.27 % | |
| 15 | 121602 | gm. Gromnik | 7 | 7 | 6651 | 2792 | 41.98 % | |
| 15 | 121603 | gm. Lisia Góra | 12 | 12 | 10845 | 5222 | 48.15 % | |
| 15 | 121604 | gm. Pleśna | 10 | 10 | 9128 | 4247 | 46.53 % | |
| 15 | 121605 | gm. Radłów | 7 | 7 | 7754 | 3222 | 41.55 % | |
| 15 | 121606 | gm. Ryglice | 7 | 7 | 8854 | 3984 | 45.00 % | |
| 15 | 121607 | gm. Rzepiennik Strzyżewski | 6 | 6 | 5281 | 2359 | 44.67 % | |
| 15 | 121608 | gm. Skrzyszów | 7 | 7 | 10422 | 4702 | 45.12 % | |
| 15 | 121616 | gm. Szerzyny | 5 | 5 | 6364 | 2604 | 40.92 % | |
| 15 | 121609 | gm. Tarnów | 15 | 15 | 18741 | 9772 | 52.14 % | |
| 15 | 121610 | gm. Tuchów | 17 | 17 | 14025 | 6944 | 49.51 % | |
| 15 | 121611 | gm. Wierzchosławice | 6 | 6 | 8329 | 4251 | 51.04 % | |
| 15 | 121612 | gm. Wietrzychowice | 5 | 5 | 3284 | 1490 | 45.37 % | |
| 15 | 121613 | gm. Wojnicz | 10 | 10 | 10306 | 4778 | 46.36 % | |
| 15 | 121614 | gm. Zakliczyn | 9 | 9 | 9495 | 4100 | 43.18 % | |
| 15 | 121615 | gm. Żabno | 10 | 10 | 14890 | 6699 | 44.99 % | |
| Attendance by level types | |||||||
| No. | Description | Precincts quantity | Electors | Number of valid ballot cards | Number of valid ballot cards / Electors | ||
| total | which provided data | ||||||
| 1 | village | 73 | 73 | 79 045 | 37 439 | 47.36 % | |
| 2 | urban-rural area | 65 | 65 | 74 026 | 33 492 | 45.24 % | |
| Maximum attendance | ||||||||
| Code | Level | Name | Precincts quantity | Electors | Number of valid ballot cards | Number of valid ballot cards / Electors | ||
| total | which provided data | |||||||
| 121609 | Commune | gm. Tarnów | 15 | 15 | 18 741 | 9 772 | 52.14 % | |
| Minimum attendance | ||||||||
| Code | Level | Name | Precincts quantity | Electors | Number of valid ballot cards | Number of valid ballot cards / Electors | ||
| total | which provided data | |||||||
| 121616 | Commune | gm. Szerzyny | 5 | 5 | 6 364 | 2 604 | 40.92 % | |

