County płońskiSejm constituency no. 16,
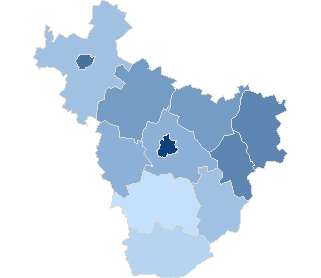
| No data | 28,78% - 30,66% | 30,67% - 32,55% | 32,56% - 34,44% | 34,45% - 36,33% | 36,34% - 38,22% | 38,23% - 40,11% | 40,12% - 42,00% | 42,01% - 43,89% | 43,90% - 45,78% | 45,79% - 47,67% |
County płońskiSejm constituency no. 16,
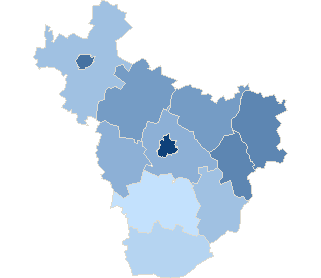
| No data | 28,78% - 30,66% | 30,67% - 32,55% | 32,56% - 34,44% | 34,45% - 36,33% | 36,34% - 38,22% | 38,23% - 40,11% | 40,12% - 42,00% | 42,01% - 43,89% | 43,90% - 45,78% | 45,79% - 47,67% |
County płońskiSejm constituency no. 16,
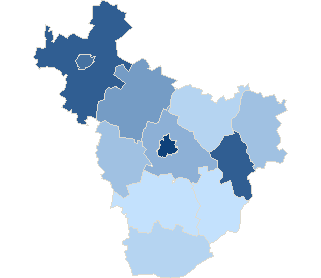
| No data | 0,86% - 1,10% | 1,11% - 1,35% | 1,36% - 1,60% | 1,61% - 1,85% | 1,86% - 2,10% | 2,11% - 2,35% | 2,36% - 2,60% | 2,61% - 2,85% | 2,86% - 3,10% | 3,11% - 3,35% |
County płońskiSejm constituency no. 16,
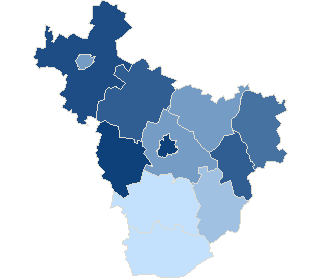
| No data | 13,45% - 14,33% | 14,34% - 15,22% | 15,23% - 16,11% | 16,12% - 17,00% | 17,01% - 17,89% | 17,90% - 18,78% | 18,79% - 19,67% | 19,68% - 20,56% | 20,57% - 21,45% | 21,46% - 22,34% |
County płońskiSejm constituency no. 16,
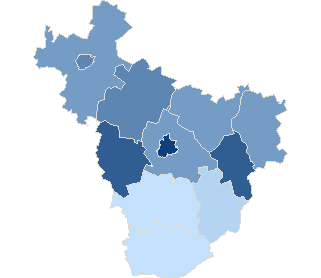
| No data | 23,26% - 24,71% | 24,72% - 26,17% | 26,18% - 27,63% | 27,64% - 29,09% | 29,10% - 30,55% | 30,56% - 32,01% | 32,02% - 33,47% | 33,48% - 34,93% | 34,94% - 36,39% | 36,40% - 37,85% |
| Attendance | ||||||||
| Constituency no. | Teryt | Name | Precincts quantity | Electors | Number of valid ballot cards | Number of valid ballot cards / Electors | ||
| total | which provided data | |||||||
| 16 | 142003 | gm. Baboszewo | 6 | 6 | 6344 | 2418 | 38.11 % | |
| 16 | 142004 | gm. Czerwińsk nad Wisłą | 5 | 5 | 6326 | 1942 | 30.70 % | |
| 16 | 142005 | gm. Dzierzążnia | 2 | 2 | 3134 | 1128 | 35.99 % | |
| 16 | 142006 | gm. Joniec | 4 | 4 | 2157 | 836 | 38.76 % | |
| 16 | 142007 | gm. Naruszewo | 5 | 5 | 5271 | 1517 | 28.78 % | |
| 16 | 142008 | gm. Nowe Miasto | 3 | 3 | 3884 | 1489 | 38.34 % | |
| 16 | 142001 | m. Płońsk | 14 | 14 | 18173 | 8651 | 47.60 % | |
| 16 | 142009 | gm. Płońsk | 8 | 8 | 5834 | 2054 | 35.21 % | |
| 16 | 142010 | gm. Raciąż | 6 | 6 | 7094 | 2392 | 33.72 % | |
| 16 | 142002 | m. Raciąż | 2 | 2 | 3729 | 1542 | 41.35 % | |
| 16 | 142011 | gm. Sochocin | 4 | 4 | 4910 | 1864 | 37.96 % | |
| 16 | 142012 | gm. Załuski | 4 | 4 | 4502 | 1513 | 33.61 % | |
| Attendance by level types | |||||||
| No. | Description | Precincts quantity | Electors | Number of valid ballot cards | Number of valid ballot cards / Electors | ||
| total | which provided data | ||||||
| 1 | city | 16 | 16 | 21 902 | 10 193 | 46.54 % | |
| 2 | village | 47 | 47 | 49 456 | 17 153 | 34.68 % | |
| Maximum attendance | ||||||||
| Code | Level | Name | Precincts quantity | Electors | Number of valid ballot cards | Number of valid ballot cards / Electors | ||
| total | which provided data | |||||||
| 142001 | Commune | m. Płońsk | 14 | 14 | 18 173 | 8 651 | 47.6 % | |
| Minimum attendance | ||||||||
| Code | Level | Name | Precincts quantity | Electors | Number of valid ballot cards | Number of valid ballot cards / Electors | ||
| total | which provided data | |||||||
| 142007 | Commune | gm. Naruszewo | 5 | 5 | 5 271 | 1 517 | 28.78 % | |

