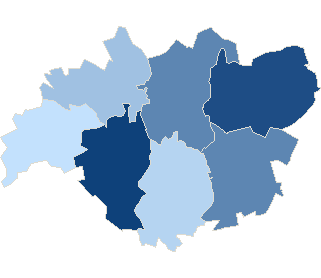
County pułtuskiSejm constituency no. 18,

| County pułtuski | |
| Statistic on 09.10.2011 | |
| Inhabitants: | 51 201 |
| Summary voting results | |
| Precincts quantity: | 49 |
| Number of precincts which transmitted result data: | 49 |
| Electors: | 40 937 |
| Number of valid ballot cards: | 18 756 |
| 45.82 % | |

|
|
| No data | 35,88% - 37,84% | 37,85% - 39,81% | 39,82% - 41,78% | 41,79% - 43,75% | 43,76% - 45,72% | 45,73% - 47,69% | 47,70% - 49,66% | 49,67% - 51,63% | 51,64% - 53,60% | 53,61% - 55,57% |
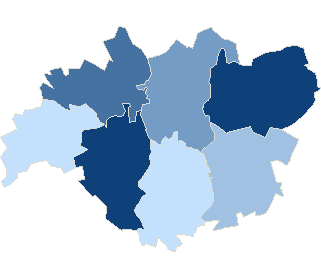
County pułtuskiSejm constituency no. 18,
| County pułtuski | |
| Statistic on 09.10.2011 | |
| Inhabitants: | 51 201 |
| Summary voting results | |
| Precincts quantity: | 49 |
| Number of precincts which transmitted result data: | 49 |
| Electors: | 40 937 |
| Number of valid ballot cards: | 18 761 |
| 45.83 % | |
|
|
|
| No data | 36,11% - 38,05% | 38,06% - 40,00% | 40,01% - 41,95% | 41,96% - 43,90% | 43,91% - 45,85% | 45,86% - 47,80% | 47,81% - 49,75% | 49,76% - 51,70% | 51,71% - 53,65% | 53,66% - 55,60% |
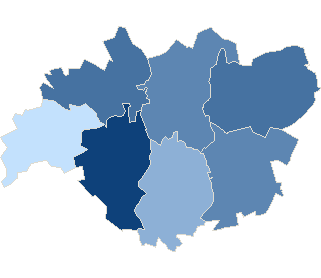
County pułtuskiSejm constituency no. 18,
| County pułtuski | |
| Statistic on 09.10.2011 | |
| Inhabitants: | 51 201 |
| Summary voting results | |
| Precincts quantity: | 49 |
| Number of precincts which transmitted result data: | 49 |
| Electors: | 40 937 |
| Number of ballot papers issued: | 1 229 |
| 3.02 % | |
|
|
|
| No data | 1,32% - 1,67% | 1,68% - 2,03% | 2,04% - 2,39% | 2,40% - 2,75% | 2,76% - 3,11% | 3,12% - 3,47% | 3,48% - 3,83% | 3,84% - 4,19% | 4,20% - 4,55% | 4,56% - 4,91% |
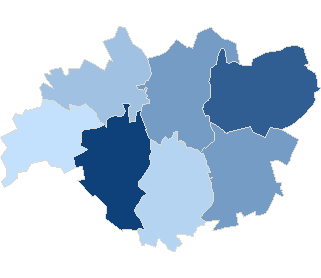
County pułtuskiSejm constituency no. 18,
| County pułtuski | |
| Statistic on 09.10.2011 | |
| Inhabitants: | 51 201 |
| Summary voting results | |
| Precincts quantity: | 49 |
| Number of precincts which transmitted result data: | 49 |
| Electors: | 40 937 |
| Number of ballot papers issued: | 9 405 |
| 23.03 % | |
|
|
|
| No data | 16,77% - 17,87% | 17,88% - 18,98% | 18,99% - 20,09% | 20,10% - 21,20% | 21,21% - 22,31% | 22,32% - 23,42% | 23,43% - 24,53% | 24,54% - 25,64% | 25,65% - 26,75% | 26,76% - 27,86% |
County pułtuskiSejm constituency no. 18,
| County pułtuski | |
| Statistic on 09.10.2011 | |
| Inhabitants: | 51 201 |
| Summary voting results | |
| Precincts quantity: | 49 |
| Number of precincts which transmitted result data: | 49 |
| Electors: | 40 937 |
| Number of ballot papers issued: | 15 498 |
| 37.90 % | |
|
|
|
| No data | 30,25% - 31,97% | 31,98% - 33,70% | 33,71% - 35,43% | 35,44% - 37,16% | 37,17% - 38,89% | 38,90% - 40,62% | 40,63% - 42,35% | 42,36% - 44,08% | 44,09% - 45,81% | 45,82% - 47,54% |
| Attendance | ||||||||
| Constituency no. | Teryt | Name | Precincts quantity | Electors | Number of valid ballot cards | Number of valid ballot cards / Electors | ||
| total | which provided data | |||||||
| 18 | 142401 | gm. Gzy | 5 | 5 | 3163 | 1289 | 40.75 % | |
| 18 | 142402 | gm. Obryte | 7 | 7 | 3907 | 2070 | 52.98 % | |
| 18 | 142403 | gm. Pokrzywnica | 5 | 5 | 3871 | 1521 | 39.29 % | |
| 18 | 142404 | gm. Pułtusk | 18 | 18 | 19094 | 8933 | 46.78 % | |
| 18 | 142405 | gm. Świercze | 5 | 5 | 3802 | 1364 | 35.88 % | |
| 18 | 142406 | gm. Winnica | 4 | 4 | 3254 | 1805 | 55.47 % | |
| 18 | 142407 | gm. Zatory | 5 | 5 | 3846 | 1774 | 46.13 % | |
| Attendance by level types | |||||||
| No. | Description | Precincts quantity | Electors | Number of valid ballot cards | Number of valid ballot cards / Electors | ||
| total | which provided data | ||||||
| 1 | village | 31 | 31 | 21 843 | 9 823 | 44.97 % | |
| 2 | urban-rural area | 18 | 18 | 19 094 | 8 933 | 46.78 % | |
| Maximum attendance | ||||||||
| Code | Level | Name | Precincts quantity | Electors | Number of valid ballot cards | Number of valid ballot cards / Electors | ||
| total | which provided data | |||||||
| 142406 | Commune | gm. Winnica | 4 | 4 | 3 254 | 1 805 | 55.47 % | |
| Minimum attendance | ||||||||
| Code | Level | Name | Precincts quantity | Electors | Number of valid ballot cards | Number of valid ballot cards / Electors | ||
| total | which provided data | |||||||
| 142405 | Commune | gm. Świercze | 5 | 5 | 3 802 | 1 364 | 35.88 % | |
- Information service info.pkw.gov.pl
- Copyright © 2011 KBW
- Contact:helpdesk@kbw.gov.pl
- Infoline: 801-081-555
- Last modification date: 10-11-2011 21:03:27
