County sanockiSejm constituency no. 22,
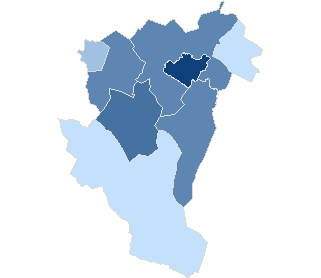
| No data | 30,66% - 32,25% | 32,26% - 33,85% | 33,86% - 35,45% | 35,46% - 37,05% | 37,06% - 38,65% | 38,66% - 40,25% | 40,26% - 41,85% | 41,86% - 43,45% | 43,46% - 45,05% | 45,06% - 46,65% |
County sanockiSejm constituency no. 22,
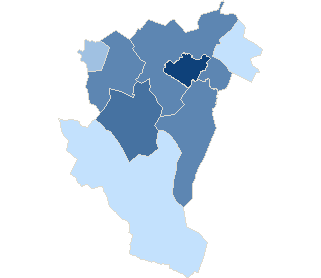
| No data | 30,66% - 32,24% | 32,25% - 33,83% | 33,84% - 35,42% | 35,43% - 37,01% | 37,02% - 38,60% | 38,61% - 40,19% | 40,20% - 41,78% | 41,79% - 43,37% | 43,38% - 44,96% | 44,97% - 46,55% |
County sanockiSejm constituency no. 22,
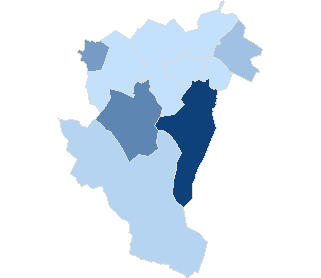
| No data | 2,64% - 2,78% | 2,79% - 2,93% | 2,94% - 3,08% | 3,09% - 3,23% | 3,24% - 3,38% | 3,39% - 3,53% | 3,54% - 3,68% | 3,69% - 3,83% | 3,84% - 3,98% | 3,99% - 4,13% |
County sanockiSejm constituency no. 22,
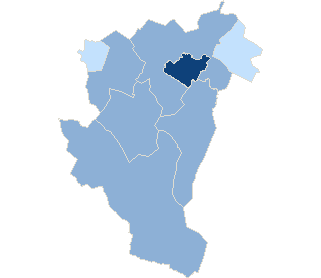
| No data | 15,97% - 16,70% | 16,71% - 17,44% | 17,45% - 18,18% | 18,19% - 18,92% | 18,93% - 19,66% | 19,67% - 20,40% | 20,41% - 21,14% | 21,15% - 21,88% | 21,89% - 22,62% | 22,63% - 23,36% |
County sanockiSejm constituency no. 22,
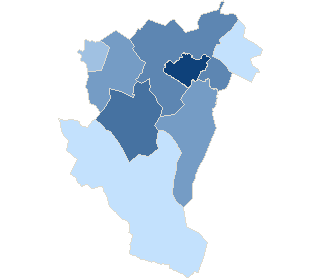
| No data | 27,11% - 28,12% | 28,13% - 29,14% | 29,15% - 30,16% | 30,17% - 31,18% | 31,19% - 32,20% | 32,21% - 33,22% | 33,23% - 34,24% | 34,25% - 35,26% | 35,27% - 36,28% | 36,29% - 37,30% |
| Attendance | ||||||||
| Constituency no. | Teryt | Name | Precincts quantity | Electors | Number of valid ballot cards | Number of valid ballot cards / Electors | ||
| total | which provided data | |||||||
| 22 | 181702 | gm. Besko | 3 | 3 | 3400 | 1164 | 34.24 % | |
| 22 | 181703 | gm. Bukowsko | 3 | 3 | 4250 | 1736 | 40.85 % | |
| 22 | 181704 | gm. Komańcza | 9 | 9 | 4795 | 1476 | 30.78 % | |
| 22 | 181701 | m. Sanok | 22 | 22 | 31951 | 14863 | 46.52 % | |
| 22 | 181705 | gm. Sanok | 18 | 18 | 13649 | 5302 | 38.85 % | |
| 22 | 181706 | gm. Tyrawa Wołoska | 1 | 1 | 1536 | 471 | 30.66 % | |
| 22 | 181707 | gm. Zagórz | 8 | 8 | 10372 | 4012 | 38.68 % | |
| 22 | 181708 | gm. Zarszyn | 7 | 7 | 7382 | 2914 | 39.47 % | |
| Attendance by level types | |||||||
| No. | Description | Precincts quantity | Electors | Number of valid ballot cards | Number of valid ballot cards / Electors | ||
| total | which provided data | ||||||
| 1 | city | 22 | 22 | 31 951 | 14 863 | 46.52 % | |
| 2 | village | 41 | 41 | 35 012 | 13 063 | 37.31 % | |
| 3 | urban-rural area | 8 | 8 | 10 372 | 4 012 | 38.68 % | |
| Maximum attendance | ||||||||
| Code | Level | Name | Precincts quantity | Electors | Number of valid ballot cards | Number of valid ballot cards / Electors | ||
| total | which provided data | |||||||
| 181701 | Commune | m. Sanok | 22 | 22 | 31 951 | 14 863 | 46.52 % | |
| Minimum attendance | ||||||||
| Code | Level | Name | Precincts quantity | Electors | Number of valid ballot cards | Number of valid ballot cards / Electors | ||
| total | which provided data | |||||||
| 181706 | Commune | gm. Tyrawa Wołoska | 1 | 1 | 1 536 | 471 | 30.66 % | |

