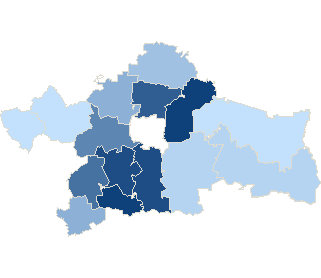
County białostockiSejm constituency no. 24,

| No data | 39,47% - 40,99% | 41,00% - 42,52% | 42,53% - 44,05% | 44,06% - 45,58% | 45,59% - 47,11% | 47,12% - 48,64% | 48,65% - 50,17% | 50,18% - 51,70% | 51,71% - 53,23% | 53,24% - 54,76% |
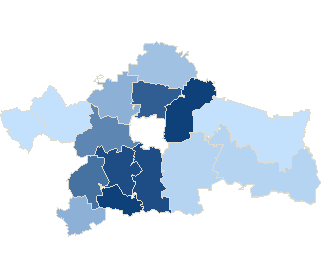
County białostockiSejm constituency no. 24,

| No data | 39,47% - 40,99% | 41,00% - 42,52% | 42,53% - 44,05% | 44,06% - 45,58% | 45,59% - 47,11% | 47,12% - 48,64% | 48,65% - 50,17% | 50,18% - 51,70% | 51,71% - 53,23% | 53,24% - 54,76% |
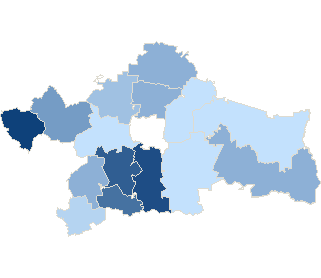
County białostockiSejm constituency no. 24,

| No data | 2,06% - 2,38% | 2,39% - 2,71% | 2,72% - 3,04% | 3,05% - 3,37% | 3,38% - 3,70% | 3,71% - 4,03% | 4,04% - 4,36% | 4,37% - 4,69% | 4,70% - 5,02% | 5,03% - 5,35% |
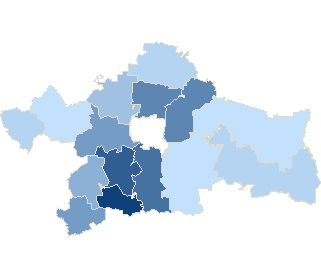
County białostockiSejm constituency no. 24,

| No data | 21,05% - 22,26% | 22,27% - 23,48% | 23,49% - 24,70% | 24,71% - 25,92% | 25,93% - 27,14% | 27,15% - 28,36% | 28,37% - 29,58% | 29,59% - 30,80% | 30,81% - 32,02% | 32,03% - 33,24% |
County białostockiSejm constituency no. 24,

| No data | 34,04% - 35,58% | 35,59% - 37,13% | 37,14% - 38,68% | 38,69% - 40,23% | 40,24% - 41,78% | 41,79% - 43,33% | 43,34% - 44,88% | 44,89% - 46,43% | 46,44% - 47,98% | 47,99% - 49,53% |
| Attendance | ||||||||
| Constituency no. | Teryt | Name | Precincts quantity | Electors | Number of valid ballot cards | Number of valid ballot cards / Electors | ||
| total | which provided data | |||||||
| 24 | 200201 | gm. Choroszcz | 11 | 11 | 11641 | 5627 | 48.34 % | |
| 24 | 200202 | gm. Czarna Białostocka | 7 | 7 | 9284 | 4022 | 43.32 % | |
| 24 | 200203 | gm. Dobrzyniewo Duże | 5 | 5 | 6672 | 2991 | 44.83 % | |
| 24 | 200204 | gm. Gródek | 8 | 8 | 4786 | 1889 | 39.47 % | |
| 24 | 200205 | gm. Juchnowiec Kościelny | 8 | 8 | 11331 | 5912 | 52.18 % | |
| 24 | 200206 | gm. Łapy | 15 | 15 | 18446 | 9067 | 49.15 % | |
| 24 | 200207 | gm. Michałowo | 11 | 11 | 6089 | 2537 | 41.67 % | |
| 24 | 200208 | gm. Poświętne | 3 | 3 | 2961 | 1333 | 45.02 % | |
| 24 | 200209 | gm. Supraśl | 7 | 7 | 10798 | 5766 | 53.40 % | |
| 24 | 200210 | gm. Suraż | 4 | 4 | 1630 | 891 | 54.66 % | |
| 24 | 200211 | gm. Turośń Kościelna | 4 | 4 | 4449 | 2342 | 52.64 % | |
| 24 | 200212 | gm. Tykocin | 8 | 8 | 5317 | 2158 | 40.59 % | |
| 24 | 200213 | gm. Wasilków | 7 | 7 | 11051 | 5635 | 50.99 % | |
| 24 | 200214 | gm. Zabłudów | 8 | 8 | 7222 | 3059 | 42.36 % | |
| 24 | 200215 | gm. Zawady | 2 | 2 | 2389 | 943 | 39.47 % | |
| Attendance by level types | |||||||
| No. | Description | Precincts quantity | Electors | Number of valid ballot cards | Number of valid ballot cards / Electors | ||
| total | which provided data | ||||||
| 1 | village | 30 | 30 | 32 588 | 15 410 | 47.29 % | |
| 2 | urban-rural area | 78 | 78 | 81 478 | 38 762 | 47.57 % | |
| Maximum attendance | ||||||||
| Code | Level | Name | Precincts quantity | Electors | Number of valid ballot cards | Number of valid ballot cards / Electors | ||
| total | which provided data | |||||||
| 200210 | Commune | gm. Suraż | 4 | 4 | 1 630 | 891 | 54.66 % | |
| Minimum attendance | ||||||||
| Code | Level | Name | Precincts quantity | Electors | Number of valid ballot cards | Number of valid ballot cards / Electors | ||
| total | which provided data | |||||||
| 200204 | Commune | gm. Gródek | 8 | 8 | 4 786 | 1 889 | 39.47 % | |

