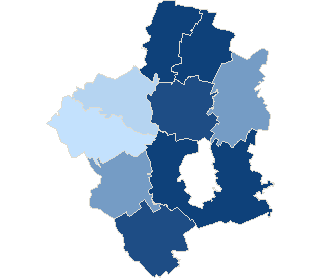
County suwalskiSejm constituency no. 24,
| County suwalski | |
| Statistic on 09.10.2011 | |
| Inhabitants: | 36 860 |
| Summary voting results | |
| Precincts quantity: | 30 |
| Number of precincts which transmitted result data: | 30 |
| Electors: | 28 723 |
| Number of valid ballot cards: | 11 066 |
| 38.53 % | |

|
|
| No data | 32,62% - 33,53% | 33,54% - 34,45% | 34,46% - 35,37% | 35,38% - 36,29% | 36,30% - 37,21% | 37,22% - 38,13% | 38,14% - 39,05% | 39,06% - 39,97% | 39,98% - 40,89% | 40,90% - 41,81% |
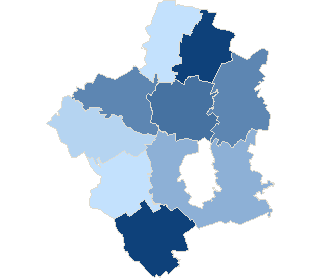
County suwalskiSejm constituency no. 24,

| County suwalski | |
| Statistic on 09.10.2011 | |
| Inhabitants: | 36 860 |
| Summary voting results | |
| Precincts quantity: | 30 |
| Number of precincts which transmitted result data: | 30 |
| Electors: | 28 723 |
| Number of valid ballot cards: | 11 061 |
| 38.51 % | |
|
|
|
| No data | 32,62% - 33,53% | 33,54% - 34,45% | 34,46% - 35,37% | 35,38% - 36,29% | 36,30% - 37,21% | 37,22% - 38,13% | 38,14% - 39,05% | 39,06% - 39,97% | 39,98% - 40,89% | 40,90% - 41,81% |
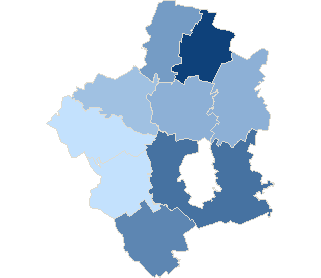
County suwalskiSejm constituency no. 24,
| County suwalski | |
| Statistic on 09.10.2011 | |
| Inhabitants: | 36 860 |
| Summary voting results | |
| Precincts quantity: | 30 |
| Number of precincts which transmitted result data: | 30 |
| Electors: | 28 723 |
| Number of ballot papers issued: | 790 |
| 2.76 % | |
|
|
|
| No data | 1,24% - 1,55% | 1,56% - 1,87% | 1,88% - 2,19% | 2,20% - 2,51% | 2,52% - 2,83% | 2,84% - 3,15% | 3,16% - 3,47% | 3,48% - 3,79% | 3,80% - 4,11% | 4,12% - 4,43% |
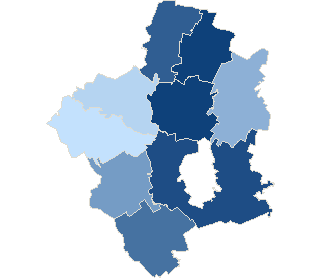
County suwalskiSejm constituency no. 24,
| County suwalski | |
| Statistic on 09.10.2011 | |
| Inhabitants: | 36 860 |
| Summary voting results | |
| Precincts quantity: | 30 |
| Number of precincts which transmitted result data: | 30 |
| Electors: | 28 723 |
| Number of ballot papers issued: | 6 261 |
| 21.85 % | |
|
|
|
| No data | 18,55% - 19,30% | 19,31% - 20,06% | 20,07% - 20,82% | 20,83% - 21,58% | 21,59% - 22,34% | 22,35% - 23,10% | 23,11% - 23,86% | 23,87% - 24,62% | 24,63% - 25,38% | 25,39% - 26,14% |
County suwalskiSejm constituency no. 24,
| County suwalski | |
| Statistic on 09.10.2011 | |
| Inhabitants: | 36 860 |
| Summary voting results | |
| Precincts quantity: | 30 |
| Number of precincts which transmitted result data: | 30 |
| Electors: | 28 723 |
| Number of ballot papers issued: | 9 638 |
| 33.58 % | |
|
|
|
| No data | 28,95% - 29,74% | 29,75% - 30,54% | 30,55% - 31,34% | 31,35% - 32,14% | 32,15% - 32,94% | 32,95% - 33,74% | 33,75% - 34,54% | 34,55% - 35,34% | 35,35% - 36,14% | 36,15% - 36,94% |
| Attendance | ||||||||
| Constituency no. | Teryt | Name | Precincts quantity | Electors | Number of valid ballot cards | Number of valid ballot cards / Electors | ||
| total | which provided data | |||||||
| 24 | 201201 | gm. Bakałarzewo | 4 | 4 | 2508 | 929 | 37.04 % | |
| 24 | 201202 | gm. Filipów | 3 | 3 | 3627 | 1183 | 32.62 % | |
| 24 | 201203 | gm. Jeleniewo | 3 | 3 | 2479 | 995 | 40.14 % | |
| 24 | 201204 | gm. Przerośl | 4 | 4 | 2407 | 820 | 34.07 % | |
| 24 | 201205 | gm. Raczki | 3 | 3 | 4802 | 1957 | 40.75 % | |
| 24 | 201206 | gm. Rutka-Tartak | 2 | 2 | 1999 | 830 | 41.52 % | |
| 24 | 201207 | gm. Suwałki | 5 | 5 | 5673 | 2343 | 41.30 % | |
| 24 | 201208 | gm. Szypliszki | 4 | 4 | 3207 | 1165 | 36.33 % | |
| 24 | 201209 | gm. Wiżajny | 2 | 2 | 2021 | 844 | 41.76 % | |
| Attendance by level types | |||||||
| No. | Description | Precincts quantity | Electors | Number of valid ballot cards | Number of valid ballot cards / Electors | ||
| total | which provided data | ||||||
| 1 | village | 30 | 30 | 28 723 | 11 066 | 38.53 % | |
| Maximum attendance | ||||||||
| Code | Level | Name | Precincts quantity | Electors | Number of valid ballot cards | Number of valid ballot cards / Electors | ||
| total | which provided data | |||||||
| 201209 | Commune | gm. Wiżajny | 2 | 2 | 2 021 | 844 | 41.76 % | |
| Minimum attendance | ||||||||
| Code | Level | Name | Precincts quantity | Electors | Number of valid ballot cards | Number of valid ballot cards / Electors | ||
| total | which provided data | |||||||
| 201202 | Commune | gm. Filipów | 3 | 3 | 3 627 | 1 183 | 32.62 % | |
- Information service info.pkw.gov.pl
- Copyright © 2011 KBW
- Contact:helpdesk@kbw.gov.pl
- Infoline: 801-081-555
- Last modification date: 10-11-2011 21:03:27
