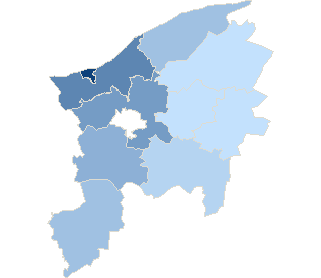
County słupskiSejm constituency no. 26,

| County słupski | |
| Statistic on 09.10.2011 | |
| Inhabitants: | 95 499 |
| Summary voting results | |
| Precincts quantity: | 73 |
| Number of precincts which transmitted result data: | 73 |
| Electors: | 75 492 |
| Number of valid ballot cards: | 29 561 |
| 39.16 % | |

|
|
| No data | 30,81% - 32,93% | 32,94% - 35,06% | 35,07% - 37,19% | 37,20% - 39,32% | 39,33% - 41,45% | 41,46% - 43,58% | 43,59% - 45,71% | 45,72% - 47,84% | 47,85% - 49,97% | 49,98% - 52,10% |
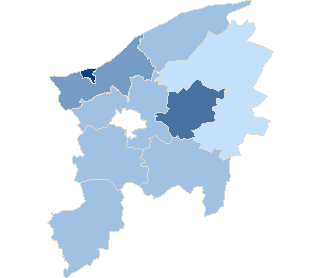
County słupskiSejm constituency no. 26,
| County słupski | |
| Statistic on 09.10.2011 | |
| Inhabitants: | 95 499 |
| Summary voting results | |
| Precincts quantity: | 73 |
| Number of precincts which transmitted result data: | 73 |
| Electors: | 75 492 |
| Number of valid ballot cards: | 29 601 |
| 39.21 % | |
|
|
|
| No data | 30,81% - 32,93% | 32,94% - 35,06% | 35,07% - 37,19% | 37,20% - 39,32% | 39,33% - 41,45% | 41,46% - 43,58% | 43,59% - 45,71% | 45,72% - 47,84% | 47,85% - 49,97% | 49,98% - 52,10% |
County słupskiSejm constituency no. 26,
| County słupski | |
| Statistic on 09.10.2011 | |
| Inhabitants: | 95 499 |
| Summary voting results | |
| Precincts quantity: | 73 |
| Number of precincts which transmitted result data: | 73 |
| Electors: | 75 492 |
| Number of ballot papers issued: | 1 550 |
| 2.07 % | |
|
|
|
| No data | 1,05% - 1,31% | 1,32% - 1,58% | 1,59% - 1,85% | 1,86% - 2,12% | 2,13% - 2,39% | 2,40% - 2,66% | 2,67% - 2,93% | 2,94% - 3,20% | 3,21% - 3,47% | 3,48% - 3,74% |
County słupskiSejm constituency no. 26,
| County słupski | |
| Statistic on 09.10.2011 | |
| Inhabitants: | 95 499 |
| Summary voting results | |
| Precincts quantity: | 73 |
| Number of precincts which transmitted result data: | 73 |
| Electors: | 75 492 |
| Number of ballot papers issued: | 14 568 |
| 19.38 % | |
|
|
|
| No data | 14,18% - 15,54% | 15,55% - 16,91% | 16,92% - 18,28% | 18,29% - 19,65% | 19,66% - 21,02% | 21,03% - 22,39% | 22,40% - 23,76% | 23,77% - 25,13% | 25,14% - 26,50% | 26,51% - 27,87% |
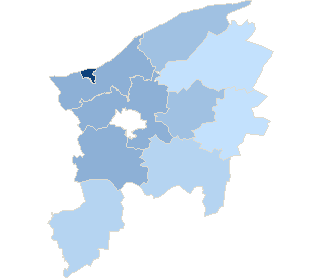
County słupskiSejm constituency no. 26,

| County słupski | |
| Statistic on 09.10.2011 | |
| Inhabitants: | 95 499 |
| Summary voting results | |
| Precincts quantity: | 73 |
| Number of precincts which transmitted result data: | 73 |
| Electors: | 75 492 |
| Number of ballot papers issued: | 24 447 |
| 32.44 % | |
|
|
|
| No data | 25,33% - 27,12% | 27,13% - 28,92% | 28,93% - 30,72% | 30,73% - 32,52% | 32,53% - 34,32% | 34,33% - 36,12% | 36,13% - 37,92% | 37,93% - 39,72% | 39,73% - 41,52% | 41,53% - 43,32% |
| Attendance | ||||||||
| Constituency no. | Teryt | Name | Precincts quantity | Electors | Number of valid ballot cards | Number of valid ballot cards / Electors | ||
| total | which provided data | |||||||
| 26 | 221202 | gm. Damnica | 3 | 3 | 4799 | 1527 | 31.82 % | |
| 26 | 221203 | gm. Dębnica Kaszubska | 6 | 6 | 7468 | 2492 | 33.37 % | |
| 26 | 221204 | gm. Główczyce | 12 | 12 | 7360 | 2280 | 30.98 % | |
| 26 | 221205 | gm. Kępice | 7 | 7 | 7313 | 2665 | 36.44 % | |
| 26 | 221206 | gm. Kobylnica | 6 | 6 | 8228 | 3230 | 39.26 % | |
| 26 | 221207 | gm. Potęgowo | 5 | 5 | 5564 | 1714 | 30.81 % | |
| 26 | 221208 | gm. Słupsk | 8 | 8 | 11573 | 4653 | 40.21 % | |
| 26 | 221209 | gm. Smołdzino | 2 | 2 | 2766 | 1023 | 36.98 % | |
| 26 | 221210 | gm. Ustka | 14 | 14 | 6214 | 2589 | 41.66 % | |
| 26 | 221201 | m. Ustka | 10 | 10 | 14207 | 7388 | 52.00 % | |
| Attendance by level types | |||||||
| No. | Description | Precincts quantity | Electors | Number of valid ballot cards | Number of valid ballot cards / Electors | ||
| total | which provided data | ||||||
| 1 | city | 10 | 10 | 14 207 | 7 388 | 52.00 % | |
| 2 | village | 56 | 56 | 53 972 | 19 508 | 36.14 % | |
| 3 | urban-rural area | 7 | 7 | 7 313 | 2 665 | 36.44 % | |
| Maximum attendance | ||||||||
| Code | Level | Name | Precincts quantity | Electors | Number of valid ballot cards | Number of valid ballot cards / Electors | ||
| total | which provided data | |||||||
| 221201 | Commune | m. Ustka | 10 | 10 | 14 207 | 7 388 | 52.0 % | |
| Minimum attendance | ||||||||
| Code | Level | Name | Precincts quantity | Electors | Number of valid ballot cards | Number of valid ballot cards / Electors | ||
| total | which provided data | |||||||
| 221207 | Commune | gm. Potęgowo | 5 | 5 | 5 564 | 1 714 | 30.81 % | |
- Information service info.pkw.gov.pl
- Copyright © 2011 KBW
- Contact:helpdesk@kbw.gov.pl
- Infoline: 801-081-555
- Last modification date: 10-11-2011 21:03:27
