County pszczyńskiSejm constituency no. 27,
| County pszczyński | |
| Statistic on 09.10.2011 | |
| Inhabitants: | 106 750 |
| Summary voting results | |
| Precincts quantity: | 63 |
| Number of precincts which transmitted result data: | 63 |
| Electors: | 84 345 |
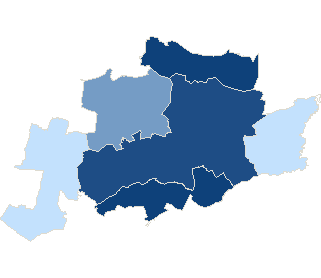
| Number of valid ballot cards: | 42 657 |
| 50.57 % | |

|
|
| No data | 47,82% - 48,29% | 48,30% - 48,77% | 48,78% - 49,25% | 49,26% - 49,73% | 49,74% - 50,21% | 50,22% - 50,69% | 50,70% - 51,17% | 51,18% - 51,65% | 51,66% - 52,13% | 52,14% - 52,61% |
County pszczyńskiSejm constituency no. 27,

| County pszczyński | |
| Statistic on 09.10.2011 | |
| Inhabitants: | 106 750 |
| Summary voting results | |
| Precincts quantity: | 63 |
| Number of precincts which transmitted result data: | 63 |
| Electors: | 84 345 |
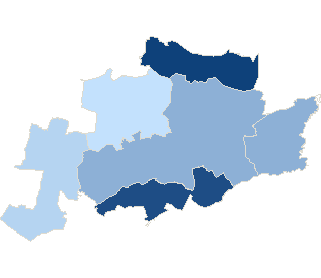
| Number of valid ballot cards: | 42 679 |
| 50.60 % | |
|
|
|
| No data | 48,05% - 48,49% | 48,50% - 48,94% | 48,95% - 49,39% | 49,40% - 49,84% | 49,85% - 50,29% | 50,30% - 50,74% | 50,75% - 51,19% | 51,20% - 51,64% | 51,65% - 52,09% | 52,10% - 52,54% |
County pszczyńskiSejm constituency no. 27,
| County pszczyński | |
| Statistic on 09.10.2011 | |
| Inhabitants: | 106 750 |
| Summary voting results | |
| Precincts quantity: | 63 |
| Number of precincts which transmitted result data: | 63 |
| Electors: | 84 345 |
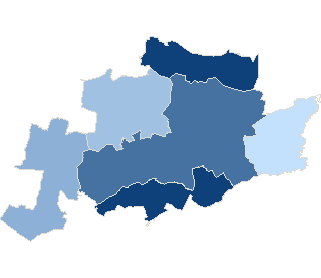
| Number of ballot papers issued: | 2 599 |
| 3.11 % | |
|
|
|
| No data | 2,61% - 2,75% | 2,76% - 2,90% | 2,91% - 3,05% | 3,06% - 3,20% | 3,21% - 3,35% | 3,36% - 3,50% | 3,51% - 3,65% | 3,66% - 3,80% | 3,81% - 3,95% | 3,96% - 4,10% |
County pszczyńskiSejm constituency no. 27,
| County pszczyński | |
| Statistic on 09.10.2011 | |
| Inhabitants: | 106 750 |
| Summary voting results | |
| Precincts quantity: | 63 |
| Number of precincts which transmitted result data: | 63 |
| Electors: | 84 345 |
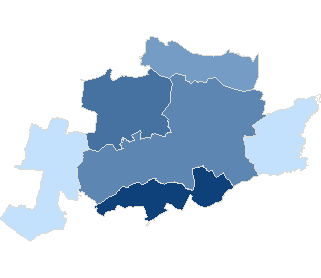
| Number of ballot papers issued: | 18 374 |
| 21.85 % | |
|
|
|
| No data | 19,68% - 20,12% | 20,13% - 20,57% | 20,58% - 21,02% | 21,03% - 21,47% | 21,48% - 21,92% | 21,93% - 22,37% | 22,38% - 22,82% | 22,83% - 23,27% | 23,28% - 23,72% | 23,73% - 24,17% |
County pszczyńskiSejm constituency no. 27,
| County pszczyński | |
| Statistic on 09.10.2011 | |
| Inhabitants: | 106 750 |
| Summary voting results | |
| Precincts quantity: | 63 |
| Number of precincts which transmitted result data: | 63 |
| Electors: | 84 345 |
| Number of ballot papers issued: | 35 079 |
| 41.67 % | |
|
|
|
| No data | 39,36% - 39,87% | 39,88% - 40,39% | 40,40% - 40,91% | 40,92% - 41,43% | 41,44% - 41,95% | 41,96% - 42,47% | 42,48% - 42,99% | 43,00% - 43,51% | 43,52% - 44,03% | 44,04% - 44,55% |
| Attendance | ||||||||
| Constituency no. | Teryt | Name | Precincts quantity | Electors | Number of valid ballot cards | Number of valid ballot cards / Electors | ||
| total | which provided data | |||||||
| 27 | 241001 | gm. Goczałkowice-Zdrój | 5 | 5 | 5399 | 2833 | 52.47 % | |
| 27 | 241002 | gm. Kobiór | 2 | 2 | 3819 | 2005 | 52.50 % | |
| 27 | 241003 | gm. Miedźna | 10 | 10 | 12405 | 5932 | 47.82 % | |
| 27 | 241004 | gm. Pawłowice | 11 | 11 | 13770 | 6617 | 48.05 % | |
| 27 | 241005 | gm. Pszczyna | 28 | 28 | 40166 | 20870 | 51.96 % | |
| 27 | 241006 | gm. Suszec | 7 | 7 | 8786 | 4400 | 50.08 % | |
| Attendance by level types | |||||||
| No. | Description | Precincts quantity | Electors | Number of valid ballot cards | Number of valid ballot cards / Electors | ||
| total | which provided data | ||||||
| 1 | village | 35 | 35 | 44 179 | 21 787 | 49.32 % | |
| 2 | urban-rural area | 28 | 28 | 40 166 | 20 870 | 51.96 % | |
| Maximum attendance | ||||||||
| Code | Level | Name | Precincts quantity | Electors | Number of valid ballot cards | Number of valid ballot cards / Electors | ||
| total | which provided data | |||||||
| 241002 | Commune | gm. Kobiór | 2 | 2 | 3 819 | 2 005 | 52.5 % | |
| Minimum attendance | ||||||||
| Code | Level | Name | Precincts quantity | Electors | Number of valid ballot cards | Number of valid ballot cards / Electors | ||
| total | which provided data | |||||||
| 241003 | Commune | gm. Miedźna | 10 | 10 | 12 405 | 5 932 | 47.82 % | |
- Information service info.pkw.gov.pl
- Copyright © 2011 KBW
- Contact:helpdesk@kbw.gov.pl
- Infoline: 801-081-555
- Last modification date: 10-11-2011 21:03:27
