County poznańskiSejm constituency no. 39,
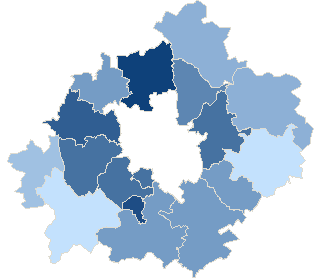
| No data | 46,24% - 48,26% | 48,27% - 50,29% | 50,30% - 52,32% | 52,33% - 54,35% | 54,36% - 56,38% | 56,39% - 58,41% | 58,42% - 60,44% | 60,45% - 62,47% | 62,48% - 64,50% | 64,51% - 66,53% |
County poznańskiSejm constituency no. 39,
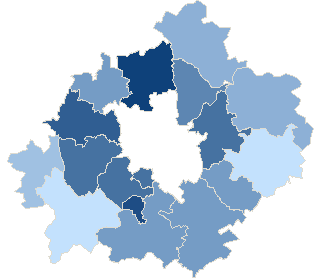
| No data | 46,26% - 48,28% | 48,29% - 50,31% | 50,32% - 52,34% | 52,35% - 54,37% | 54,38% - 56,40% | 56,41% - 58,43% | 58,44% - 60,46% | 60,47% - 62,49% | 62,50% - 64,52% | 64,53% - 66,55% |
County poznańskiSejm constituency no. 39,
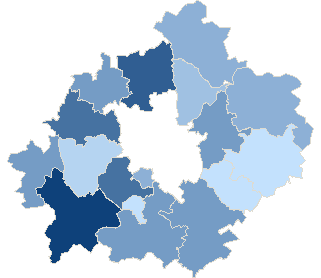
| No data | 1,63% - 1,82% | 1,83% - 2,02% | 2,03% - 2,22% | 2,23% - 2,42% | 2,43% - 2,62% | 2,63% - 2,82% | 2,83% - 3,02% | 3,03% - 3,22% | 3,23% - 3,42% | 3,43% - 3,62% |
County poznańskiSejm constituency no. 39,
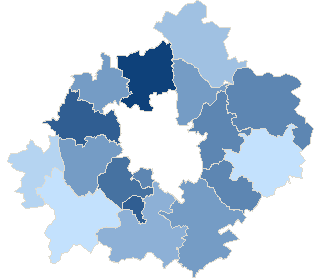
| No data | 19,97% - 20,94% | 20,95% - 21,92% | 21,93% - 22,90% | 22,91% - 23,88% | 23,89% - 24,86% | 24,87% - 25,84% | 25,85% - 26,82% | 26,83% - 27,80% | 27,81% - 28,78% | 28,79% - 29,76% |
County poznańskiSejm constituency no. 39,
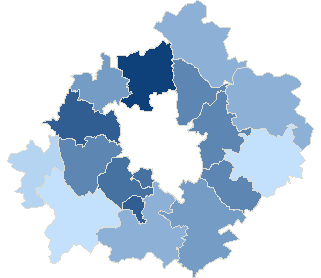
| No data | 36,88% - 38,47% | 38,48% - 40,07% | 40,08% - 41,67% | 41,68% - 43,27% | 43,28% - 44,87% | 44,88% - 46,47% | 46,48% - 48,07% | 48,08% - 49,67% | 49,68% - 51,27% | 51,28% - 52,87% |
| Attendance | ||||||||
| Constituency no. | Teryt | Name | Precincts quantity | Electors | Number of valid ballot cards | Number of valid ballot cards / Electors | ||
| total | which provided data | |||||||
| 39 | 302103 | gm. Buk | 6 | 6 | 9458 | 4823 | 50.99 % | |
| 39 | 302104 | gm. Czerwonak | 14 | 14 | 20246 | 11474 | 56.67 % | |
| 39 | 302105 | gm. Dopiewo | 11 | 11 | 13957 | 8265 | 59.22 % | |
| 39 | 302106 | gm. Kleszczewo | 3 | 3 | 4628 | 2588 | 55.92 % | |
| 39 | 302107 | gm. Komorniki | 13 | 13 | 14932 | 8905 | 59.64 % | |
| 39 | 302108 | gm. Kostrzyn | 11 | 11 | 13227 | 6273 | 47.43 % | |
| 39 | 302109 | gm. Kórnik | 10 | 10 | 15883 | 8906 | 56.07 % | |
| 39 | 302101 | m. Luboń | 13 | 13 | 22566 | 13490 | 59.78 % | |
| 39 | 302110 | gm. Mosina | 20 | 20 | 21801 | 11943 | 54.78 % | |
| 39 | 302111 | gm. Murowana Goślina | 11 | 11 | 12823 | 6747 | 52.62 % | |
| 39 | 302112 | gm. Pobiedziska | 10 | 10 | 14094 | 7436 | 52.76 % | |
| 39 | 302102 | m. Puszczykowo | 5 | 5 | 7968 | 5123 | 64.29 % | |
| 39 | 302113 | gm. Rokietnica | 6 | 6 | 9614 | 5357 | 55.72 % | |
| 39 | 302114 | gm. Stęszew | 8 | 8 | 11504 | 5319 | 46.24 % | |
| 39 | 302115 | gm. Suchy Las | 7 | 7 | 11007 | 7312 | 66.43 % | |
| 39 | 302116 | gm. Swarzędz | 23 | 23 | 34004 | 19937 | 58.63 % | |
| 39 | 302117 | gm. Tarnowo Podgórne | 12 | 12 | 16741 | 10396 | 62.10 % | |
| Attendance by level types | |||||||
| No. | Description | Precincts quantity | Electors | Number of valid ballot cards | Number of valid ballot cards / Electors | ||
| total | which provided data | ||||||
| 1 | city | 18 | 18 | 30 534 | 18 613 | 60.96 % | |
| 2 | village | 66 | 66 | 91 125 | 54 297 | 59.59 % | |
| 3 | urban-rural area | 99 | 99 | 132 794 | 71 384 | 53.76 % | |
| Maximum attendance | ||||||||
| Code | Level | Name | Precincts quantity | Electors | Number of valid ballot cards | Number of valid ballot cards / Electors | ||
| total | which provided data | |||||||
| 302115 | Commune | gm. Suchy Las | 7 | 7 | 11 007 | 7 312 | 66.43 % | |
| Minimum attendance | ||||||||
| Code | Level | Name | Precincts quantity | Electors | Number of valid ballot cards | Number of valid ballot cards / Electors | ||
| total | which provided data | |||||||
| 302114 | Commune | gm. Stęszew | 8 | 8 | 11 504 | 5 319 | 46.24 % | |

