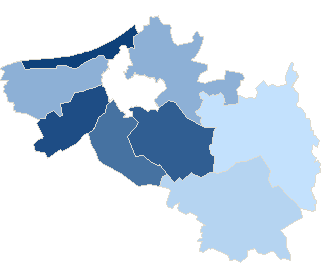
County koszalińskiSejm constituency no. 40,
| County koszaliński | |
| Statistic on 09.10.2011 | |
| Inhabitants: | 64 651 |
| Summary voting results | |
| Precincts quantity: | 57 |
| Number of precincts which transmitted result data: | 57 |
| Electors: | 51 572 |
| Number of valid ballot cards: | 21 231 |
| 41.17 % | |

|
|
| No data | 32,43% - 34,46% | 34,47% - 36,50% | 36,51% - 38,54% | 38,55% - 40,58% | 40,59% - 42,62% | 42,63% - 44,66% | 44,67% - 46,70% | 46,71% - 48,74% | 48,75% - 50,78% | 50,79% - 52,82% |
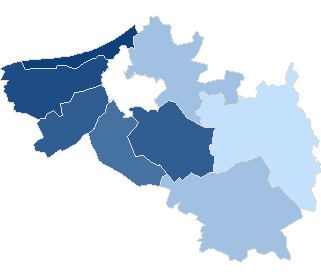
County koszalińskiSejm constituency no. 40,

| County koszaliński | |
| Statistic on 09.10.2011 | |
| Inhabitants: | 64 651 |
| Summary voting results | |
| Precincts quantity: | 57 |
| Number of precincts which transmitted result data: | 57 |
| Electors: | 51 572 |
| Number of valid ballot cards: | 21 233 |
| 41.17 % | |
|
|
|
| No data | 32,43% - 34,46% | 34,47% - 36,50% | 36,51% - 38,54% | 38,55% - 40,58% | 40,59% - 42,62% | 42,63% - 44,66% | 44,67% - 46,70% | 46,71% - 48,74% | 48,75% - 50,78% | 50,79% - 52,82% |
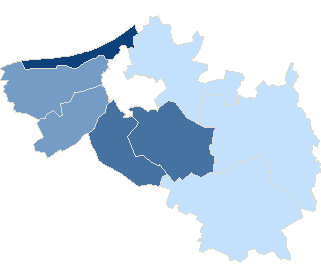
County koszalińskiSejm constituency no. 40,
| County koszaliński | |
| Statistic on 09.10.2011 | |
| Inhabitants: | 64 651 |
| Summary voting results | |
| Precincts quantity: | 57 |
| Number of precincts which transmitted result data: | 57 |
| Electors: | 51 572 |
| Number of ballot papers issued: | 928 |
| 1.82 % | |
|
|
|
| No data | 1,29% - 1,39% | 1,40% - 1,50% | 1,51% - 1,61% | 1,62% - 1,72% | 1,73% - 1,83% | 1,84% - 1,94% | 1,95% - 2,05% | 2,06% - 2,16% | 2,17% - 2,27% | 2,28% - 2,38% |
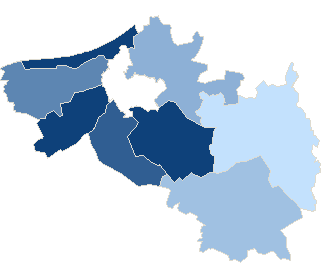
County koszalińskiSejm constituency no. 40,
| County koszaliński | |
| Statistic on 09.10.2011 | |
| Inhabitants: | 64 651 |
| Summary voting results | |
| Precincts quantity: | 57 |
| Number of precincts which transmitted result data: | 57 |
| Electors: | 51 572 |
| Number of ballot papers issued: | 9 876 |
| 19.22 % | |
|
|
|
| No data | 14,93% - 16,21% | 16,22% - 17,50% | 17,51% - 18,79% | 18,80% - 20,08% | 20,09% - 21,37% | 21,38% - 22,66% | 22,67% - 23,95% | 23,96% - 25,24% | 25,25% - 26,53% | 26,54% - 27,82% |
County koszalińskiSejm constituency no. 40,
| County koszaliński | |
| Statistic on 09.10.2011 | |
| Inhabitants: | 64 651 |
| Summary voting results | |
| Precincts quantity: | 57 |
| Number of precincts which transmitted result data: | 57 |
| Electors: | 51 572 |
| Number of ballot papers issued: | 17 042 |
| 33.08 % | |
|
|
|
| No data | 26,53% - 27,75% | 27,76% - 28,98% | 28,99% - 30,21% | 30,22% - 31,44% | 31,45% - 32,67% | 32,68% - 33,90% | 33,91% - 35,13% | 35,14% - 36,36% | 36,37% - 37,59% | 37,60% - 38,82% |
| Attendance | ||||||||
| Constituency no. | Teryt | Name | Precincts quantity | Electors | Number of valid ballot cards | Number of valid ballot cards / Electors | ||
| total | which provided data | |||||||
| 40 | 320901 | gm. Będzino | 6 | 6 | 6675 | 2599 | 38.94 % | |
| 40 | 320902 | gm. Biesiekierz | 4 | 4 | 4532 | 2225 | 49.10 % | |
| 40 | 320903 | gm. Bobolice | 11 | 11 | 7979 | 2845 | 35.66 % | |
| 40 | 320904 | gm. Manowo | 6 | 6 | 5148 | 2442 | 47.44 % | |
| 40 | 320905 | gm. Mielno | 5 | 5 | 4529 | 2389 | 52.75 % | |
| 40 | 320906 | gm. Polanów | 9 | 9 | 7135 | 2314 | 32.43 % | |
| 40 | 320907 | gm. Sianów | 9 | 9 | 10576 | 4122 | 38.98 % | |
| 40 | 320908 | gm. Świeszyno | 7 | 7 | 4998 | 2295 | 45.92 % | |
| Attendance by level types | |||||||
| No. | Description | Precincts quantity | Electors | Number of valid ballot cards | Number of valid ballot cards / Electors | ||
| total | which provided data | ||||||
| 1 | village | 28 | 28 | 25 882 | 11 950 | 46.17 % | |
| 2 | urban-rural area | 29 | 29 | 25 690 | 9 281 | 36.13 % | |
| Maximum attendance | ||||||||
| Code | Level | Name | Precincts quantity | Electors | Number of valid ballot cards | Number of valid ballot cards / Electors | ||
| total | which provided data | |||||||
| 320905 | Commune | gm. Mielno | 5 | 5 | 4 529 | 2 389 | 52.75 % | |
| Minimum attendance | ||||||||
| Code | Level | Name | Precincts quantity | Electors | Number of valid ballot cards | Number of valid ballot cards / Electors | ||
| total | which provided data | |||||||
| 320906 | Commune | gm. Polanów | 9 | 9 | 7 135 | 2 314 | 32.43 % | |
- Information service info.pkw.gov.pl
- Copyright © 2011 KBW
- Contact:helpdesk@kbw.gov.pl
- Infoline: 801-081-555
- Last modification date: 10-11-2011 21:03:27
