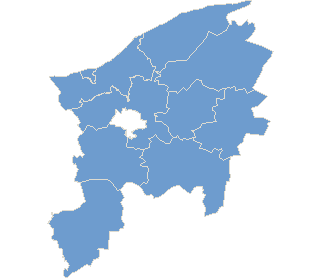
| County słupski | |
| Statistic on 09.10.2011 | |
| Inhabitants: | 95 499 |
| Electoral statistics | |
| Precincts quantity: | 73 |
| Electors: | 75 492 |
| Communes | |||||||||
| Teryt | Description | Number of | Attendance | No. of valid votes | % of valid votes | ||||
| entitled to vote | ballot paper issued | valid cards | |||||||
| 221202 | Damnica, gm. | 4 799 | 1 569 | 1 527 | 31,82% | 1 427 | 93,45% | ||
| 221203 | Dębnica Kaszubska, gm. | 7 468 | 2 529 | 2 492 | 33,37% | 2 351 | 94,34% | ||
| 221204 | Główczyce, gm. | 7 360 | 2 280 | 2 280 | 30,98% | 2 095 | 91,89% | ||
| 221205 | Kępice, gm. | 7 313 | 2 665 | 2 665 | 36,44% | 2 429 | 91,14% | ||
| 221206 | Kobylnica, gm. | 8 228 | 3 230 | 3 230 | 39,26% | 3 030 | 93,81% | ||
| 221207 | Potęgowo, gm. | 5 564 | 1 714 | 1 714 | 30,81% | 1 560 | 91,02% | ||
| 221208 | Słupsk, gm. | 11 573 | 4 655 | 4 653 | 40,21% | 4 394 | 94,43% | ||
| 221209 | Smołdzino, gm. | 2 766 | 1 023 | 1 023 | 36,98% | 939 | 91,79% | ||
| 221210 | Ustka, gm. | 6 214 | 2 592 | 2 589 | 41,66% | 2 465 | 95,21% | ||
| 221201 | Ustka, m. | 14 207 | 7 389 | 7 388 | 52,00% | 7 054 | 95,48% | ||
| Total | 75 492 | 29 646 | 29 561 | 39,16% | 27 744 | 93,85% | |||
| List no. 6 - Komitet Wyborczy Polska Partia Pracy - Sierpień 80 - Registered | ||||
| Number on the list | Surname and Names | Number of valid votes for candidate | % of valid votes | |
| 1 | Meyer Mieczysław Jan | 45 | 0,16% | |
| 2 | Kamińska Elżbieta | 34 | 0,12% | |
| 3 | Ewiak Sławomir Adam | 6 | 0,02% | |
| 4 | Hordyniec Waldemar | 8 | 0,03% | |
| 5 | Kowalko Małgorzata | 8 | 0,03% | |
| 6 | Gałecka Beata Bogumiła | 9 | 0,03% | |
| 7 | Cieślik Krzysztof | 12 | 0,04% | |
| 8 | Sajna Mariola | 7 | 0,03% | |
| 9 | Leśniak Agata Agnieszka | 9 | 0,03% | |
| 10 | Daduń Kamila Zofia | 3 | 0,01% | |
| 11 | Kościelna Regina Józefa | 4 | 0,01% | |
| 12 | Daduń Franciszek | 3 | 0,01% | |
| 13 | Kazimierczak Jerzy | 8 | 0,03% | |
| 14 | Łunieski Piotr | 6 | 0,02% | |
| 15 | Gabrych Edyta | 3 | 0,01% | |
| 16 | Kryszałowicz Tomasz | 14 | 0,05% | |
| 17 | Ossowski Andrzej Zbigniew | 2 | 0,01% | |
| 18 | Drążkowski Wojciech Tomasz | 2 | 0,01% | |
| 19 | Dubiel Irena | 7 | 0,03% | |
| 20 | Bruska Beata Elżbieta | 13 | 0,05% | |
| 21 | Bonat Mateusz Waldemar | 17 | 0,06% | |
| Votes for list | 220 | 0,79% | ||
| Communes | |||||||||
| Teryt | Description | Number of | Attendance | No. of valid votes | % of valid votes | ||||
| entitled to vote | ballot paper issued | valid cards | |||||||
| 221202 | Damnica, gm. | 4 799 | 1 568 | 1 552 | 32,34% | 1 514 | 97,55% | ||
| 221203 | Dębnica Kaszubska, gm. | 7 468 | 2 529 | 2 510 | 33,61% | 2 436 | 97,05% | ||
| 221204 | Główczyce, gm. | 7 360 | 2 279 | 2 279 | 30,96% | 2 194 | 96,27% | ||
| 221205 | Kępice, gm. | 7 313 | 2 665 | 2 662 | 36,40% | 2 570 | 96,54% | ||
| 221206 | Kobylnica, gm. | 8 228 | 3 230 | 3 230 | 39,26% | 3 083 | 95,45% | ||
| 221207 | Potęgowo, gm. | 5 564 | 1 714 | 1 714 | 30,81% | 1 642 | 95,80% | ||
| 221208 | Słupsk, gm. | 11 573 | 4 654 | 4 654 | 40,21% | 4 483 | 96,33% | ||
| 221209 | Smołdzino, gm. | 2 766 | 1 023 | 1 023 | 36,98% | 984 | 96,19% | ||
| 221210 | Ustka, gm. | 6 214 | 2 592 | 2 592 | 41,71% | 2 507 | 96,72% | ||
| 221201 | Ustka, m. | 14 207 | 7 388 | 7 385 | 51,98% | 7 136 | 96,63% | ||
| Total | 75 492 | 29 642 | 29 601 | 39,21% | 28 549 | 96,45% | |||
| Candidates for Senate | ||||
| No. | Surname and Names | Number of valid votes for candidate | % of valid votes | |
| 1 | Boba Hubert Piotr | 5 463 | 19,14% | |
| 2 | Kleina Kazimierz Mariusz | 15 434 | 54,06% | |
| 3 | Stepnowski Andrzej | 5 445 | 19,07% | |
| 4 | Wołoszyn Roman Józef | 2 207 | 7,73% | |
